Ice Sheet Assessments |
 |
2015 Ice Sheet Assessment
Aaron Letterly
Cooperative Institute for Meteorological Satellite Studies, University of Wisconsin, Madison, WI, USA
24 November 2016
Greenland Surface Melt
Over 80% of Greenland is covered by an ice sheet, which is not a single glacier but rather an icy land mass of continental size covering the underlying topography. Much of the ice lost each year from Greenland is discharged as marine-terminating outlet glaciers, which slowly detach from the Greenland ice sheet and slide into the ocean (known as tongues). However, surface melt is also significant contributor to the overall loss of ice sheet mass. Surface melt extent in Greenland was at its 11th highest of the 32 years on record in 2015 (NSIDC, 2015), with favorable melting conditions in the north and northwestern ice sheet. Figure 1 shows that while there were a small number of extreme melting days in June, most of the surface melting was within two standard deviations of the 30-year average (NSIDC, 2015).

Figure 1: Daily extent percentage of Greenland ice sheet surface melting in 2015. The 1981-2010 average is shown by the blue dashed line, while shaded regions show two standard deviations around the average. Image from NSIDC.
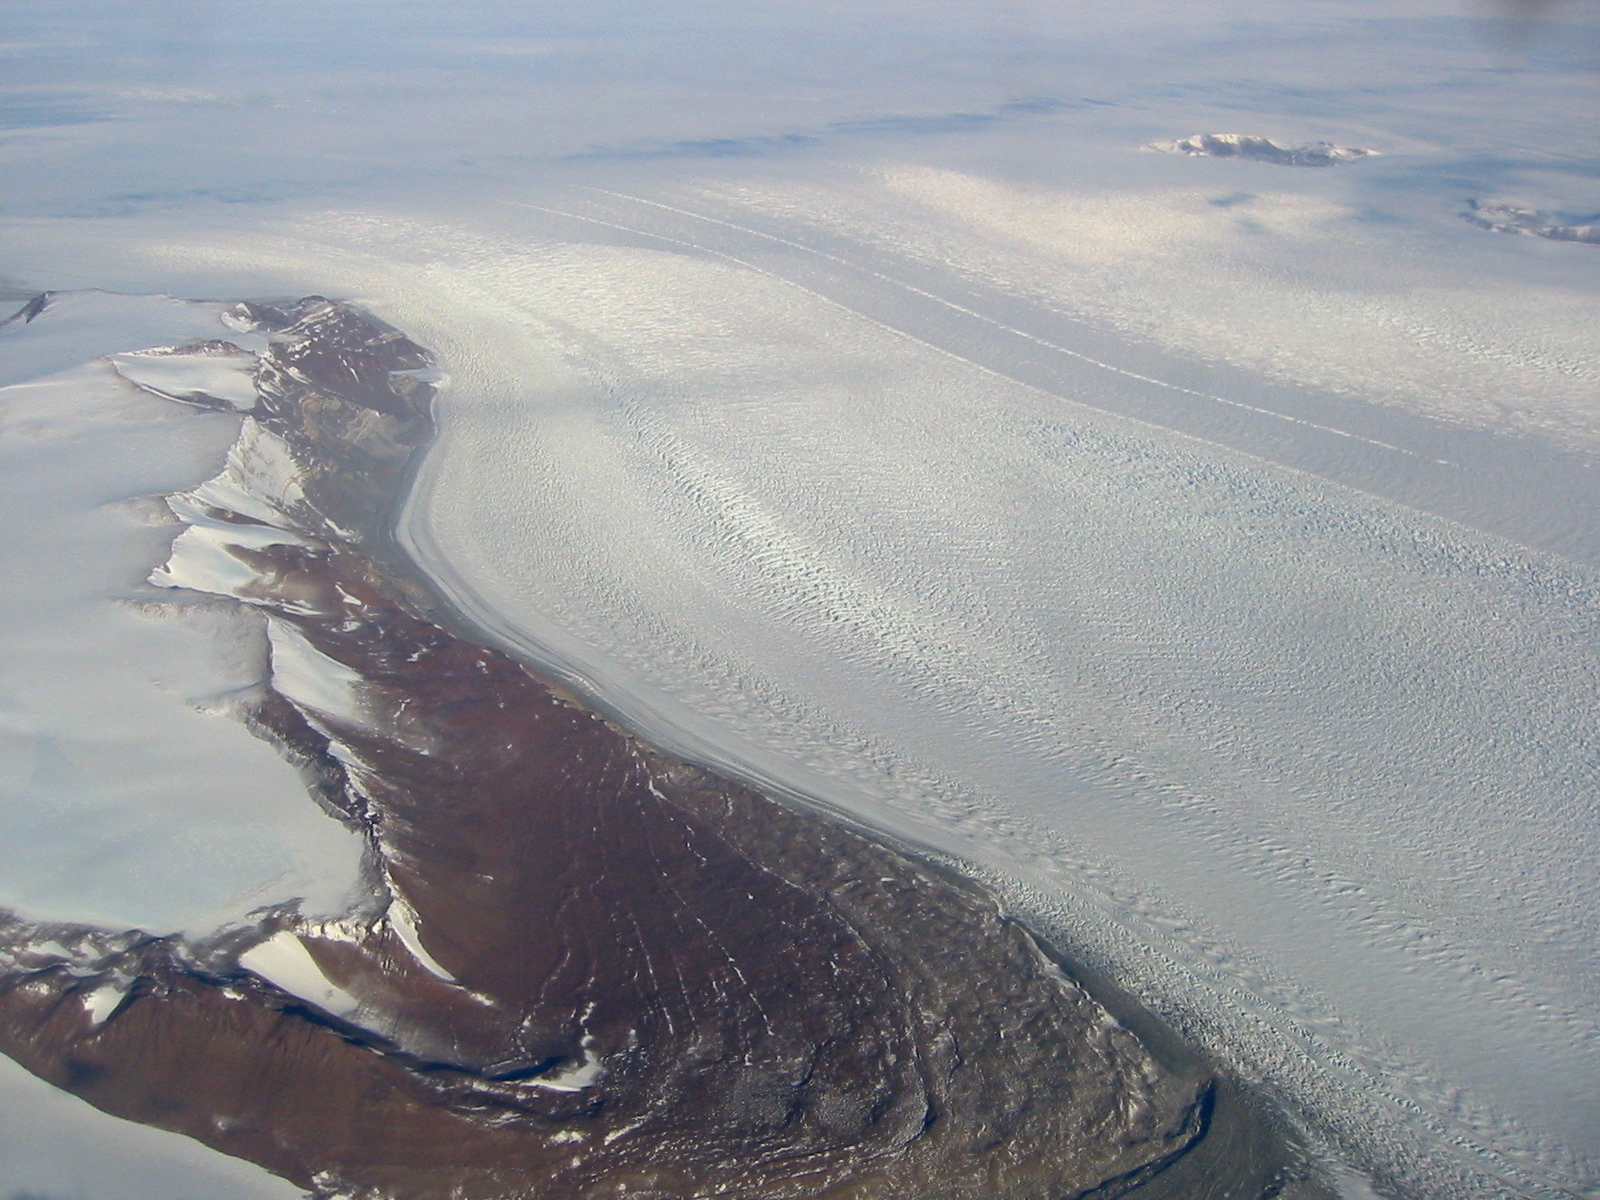
Satellite imagery can be used to remotely monitor the changes of glacial tongue location many times over the course of a melting season. Several years of satellite imagery may be compared to determine the relative position of a glacial tongue, and can then provide information about the mass balance of the glacier at a particular time. Glacier front positions are available on the Polar Portal. (Graphics from the Polar Portal cannot be included here due to copyright protection.) Both the Humboldt and Upernavik glacial tongues on the north and western coasts of Greenland, respectively, had receded past their 1990 and 2000 benchmarks. The enhanced number of melt days in northern and western Greenland resulted in reduced glacial extent by June. In contrast, however, the Ikertivaq glacier experienced a relatively lower amount of melting days in 2015 than average, and its glacial outflow extent is on par (at least in June) with 1990 and 2000 marks.
Antarctic Mass Balance Changes
Antarctic ice growth and extent slowed in 2015 compared to the last three years, in which consecutive winter maxima records were set. Rates of snow accumulation in some areas were enough to offset localized sea ice losses, but, overall, Antarctica is still experiencing a net loss of glacial mass greater than 1,000 gigatonnes per year. This trend of continent-wide decreasing ice mass has persisted since 2004 (http://climate.nasa.gov/vital-signs/land-ice/). In August 2015, Antarctica was losing 1936 gigatonnes of ice per year, the largest rate of mass loss ever recorded by NASA’s Gravity Recovery and Climate Experiment (GRACE) satellite. Figure 2 shows the trend in ice mass losses over the last 15 years.

Figure 2: Ice mass measurement from NASA’s GRACE satellite in gigatonnes of ice in land ice sheets per year since 2002. Image is from NASA.
References
Citterio, M. and Ahlstrøm, P. (2013): Brief Communication “The aerophotogrammetric map of Greenland ice masses.” The Cryosphere, 7, p. 445-449.
Howat, I. M., Negrete, A., and Smith, B. E. (2014): The Greenland Ice Mapping Project (GIMP) land classification and surface elevation datasets, The Cryosphere Discuss., 8, p. 453–478, doi:10.5194/tcd-8-453-2014.
NSIDC, 2015: 2015 melt season in review, National Snow and Ice Data Center, http://nsidc.org/greenland-today/category/analysis/, November 3, 2015.
Larsen, C.F., E. Burgess, A. A. Arentdt, S. O’Neel, A.J. Johnson, and C. Kienholz (2015): Suface melt dominates Alaska glacier mass balance, Geophysical Research Letters, 42, p. 5902-5908, doi: 10.1002/2015GL064349.
Pelto, M., 2015: “From a Glacier’s Perspective”, http://blogs.agu.org/fromaglaciersperspective/2015/08/20/disastrous-year-for-north-cascade-glacier-mass-balance-snowice-economy.