 |
Metadata
|
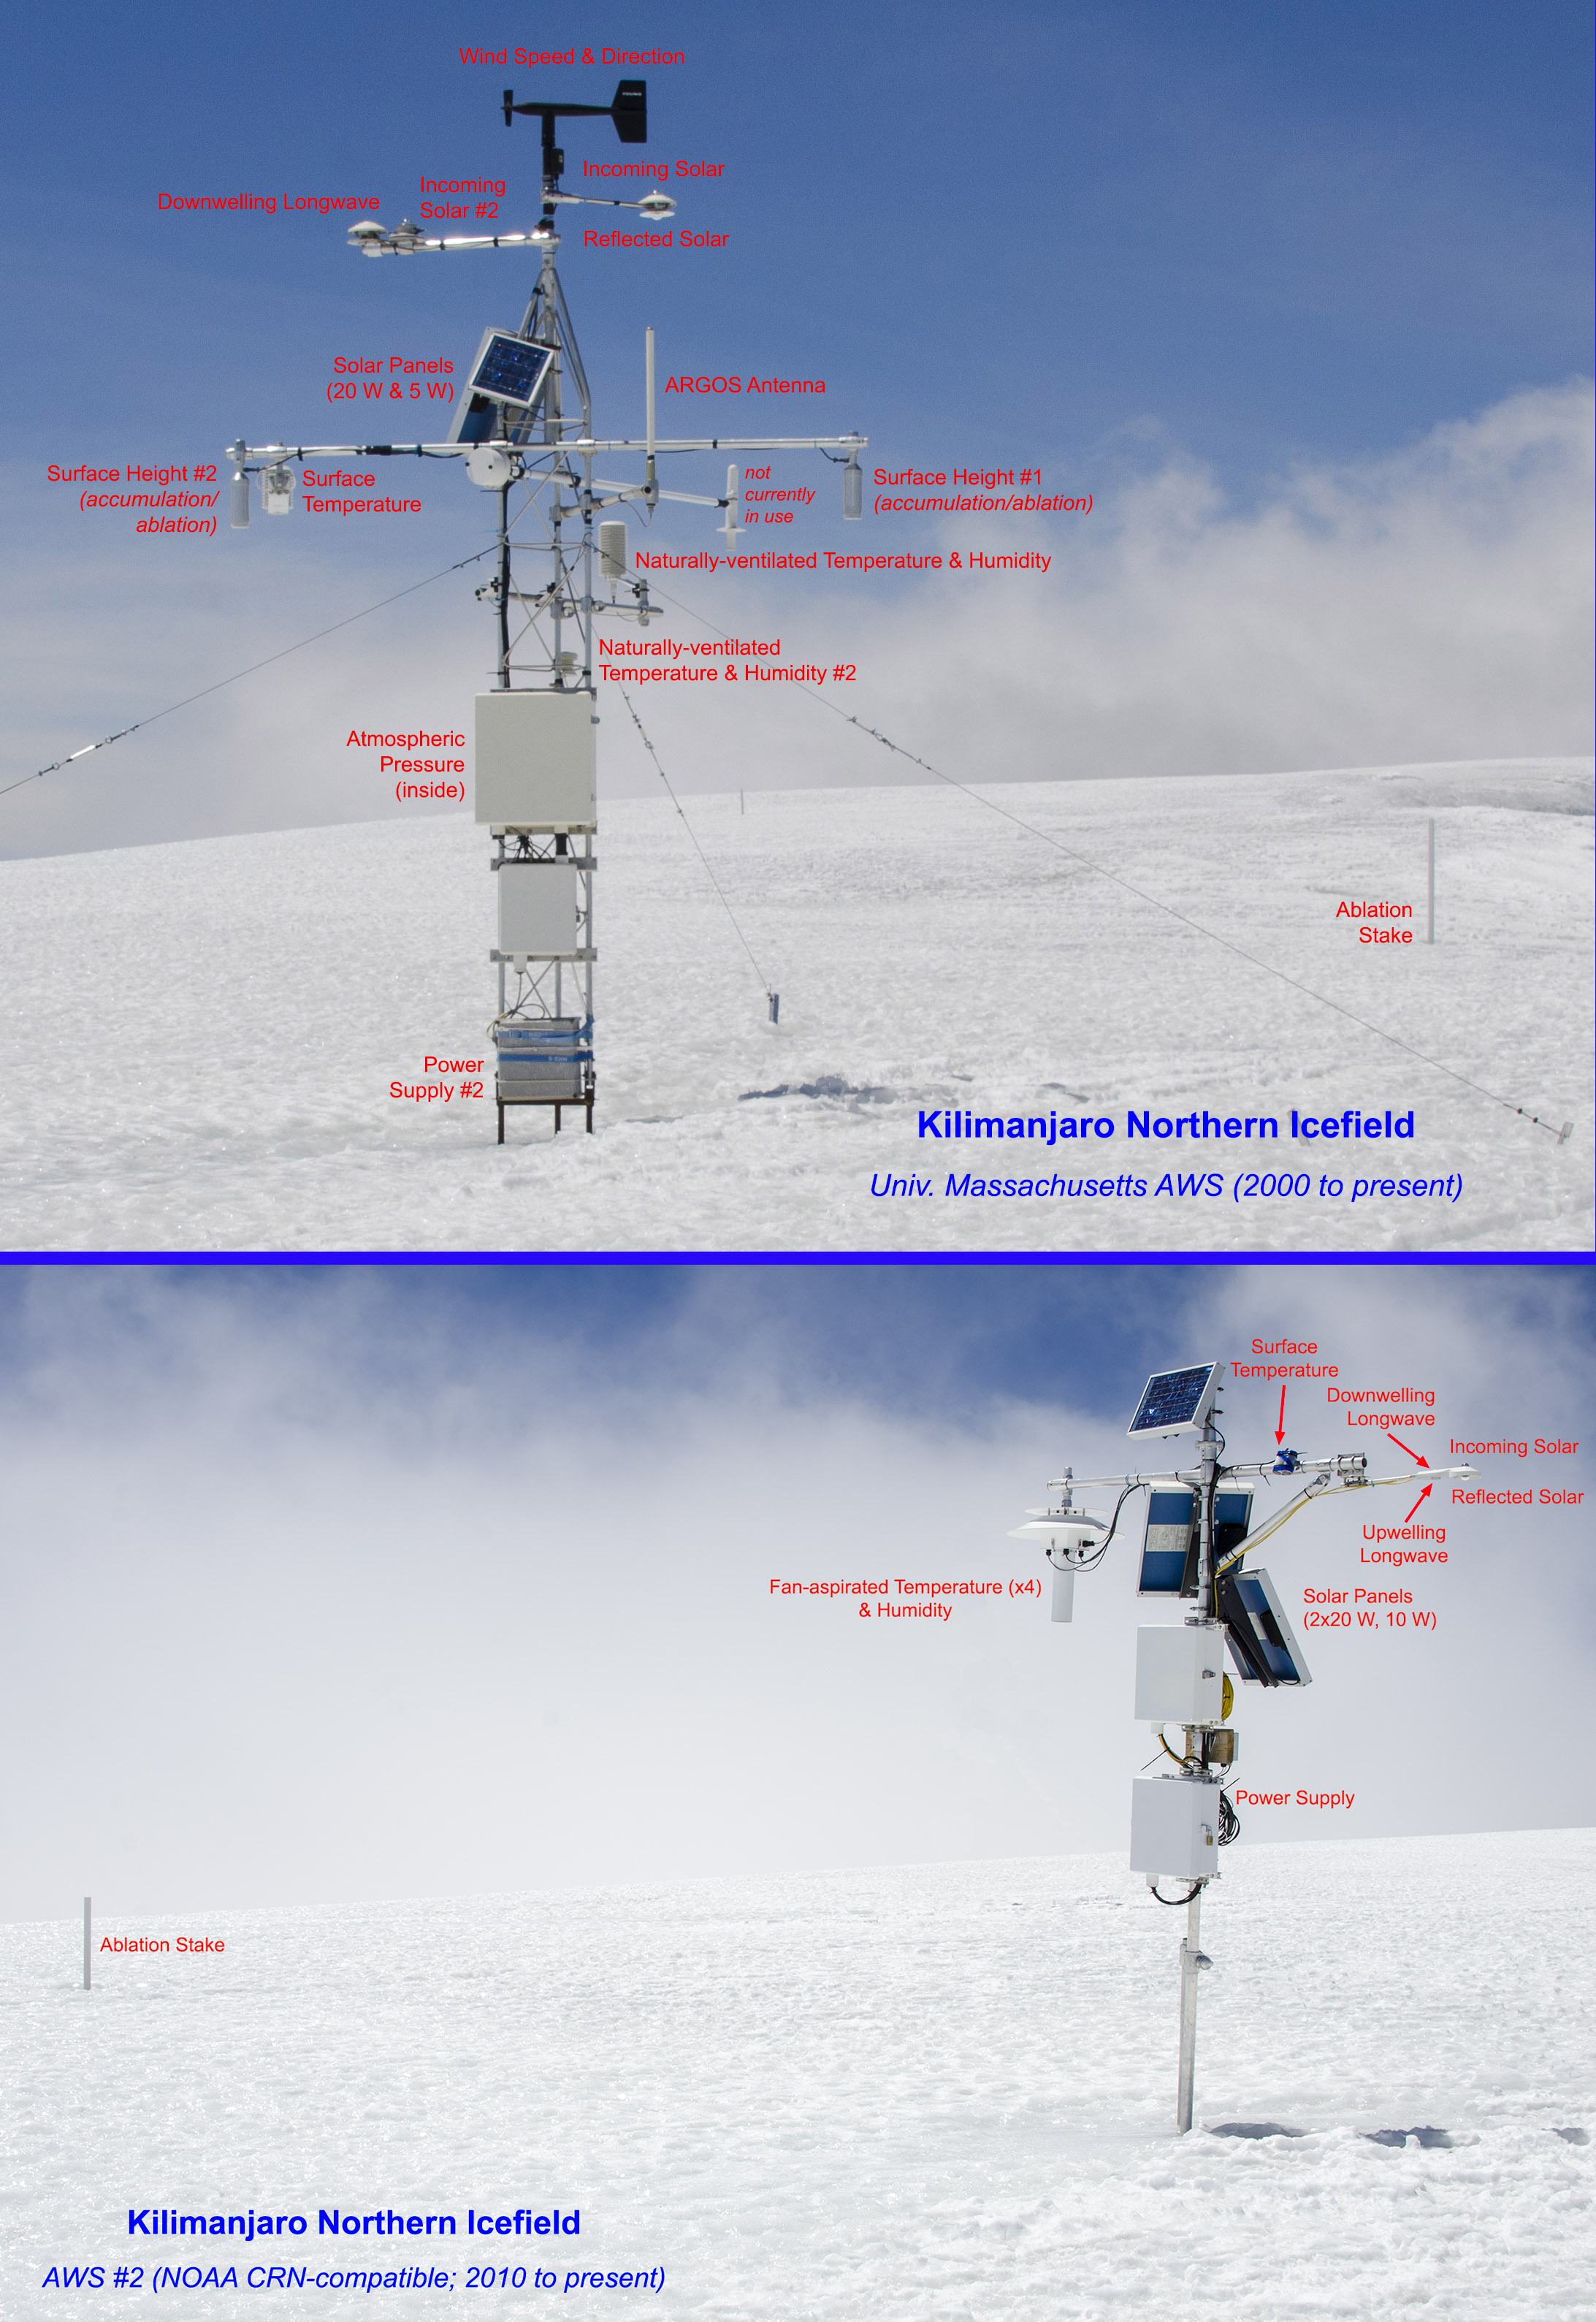
Kilimanjaro Northern Icefield
Reference CryoNet Station Information
Other Networks to Which This CryoNet Station Belongs
- Collaborative research “Climate Change and Glaciers on Kilimanjaro� since 2001 with Georg Kaser (University Innsbruck, Austria) and Thomas Mölg (University Erlangen-Nürnberg, Germany).
Other relevant measurement method documents:
A variety of documented methods are followed, for both meteorological and cryospheric measurements. However, the station elevation and relatively infrequent visitation has required modification of these; metadata exist for all measurements.
Data Information
- Are the data quality controlled? yes
- How are the data accessible? FTP, HTTP (web)
- Data availability (may depend on the variable measured): in near real-time, delayed more than one year
Publications
Cullen N.J., P. Sirguey, T. Mölg, G. Kaser, M. Winkler, and S.J. Fitzsimons (2013): A century of ice retreat on Kilimanjaro: The mapping reloaded. The Cryosphere, vol. 7, pp. 419-431.
Hardy, D.R. (2011): Kilimanjaro. In: Singh, V.P., P. Singh, and U.K. Haritashya (eds.) Encyclopedia of Snow, Ice and Glaciers. Dordrecht: Springer, p. 672-679.
Meyer, H. (1891): Across East African glaciers. George Philip & Son, London, 397 pp.
Mölg, T. and D.R. Hardy (2004): Ablation and associated energy balance on a horizontal glacier surface on Kilimanjaro. J. Geophys. Res. - Atm., 109, D16104, doi:10.1029/2003JD004338.
Thompson, L.G., E. Mosley-Thompson, M.E. Davis, K.A. Henderson, H. Brecher, V.S. Zagorodnov, P.-N. Lin, T. Mashiotta, V.N. Mikhalenko, D.R. Hardy, and J. Beer (2002): Kilimanjaro ice core records: Evidence of Holocene climate change in tropical Africa. Science, v. 298, no. 5593, p. 589-593.
Measurements
The measurements made at Kilimanjaro Northern Icefield are listed in the following tables. (Note: If End Year is blank, measurements are ongoing.)
Cryosphere Measurements
| Atmosphere Measurements
|
Measurement Notes and Other Measurements
| Category | Description or List |
|---|---|
| Snow | At AWS, surface height is measured hourly. Data are post-processed using a moving average to remove a residual diurnal cycle in the temperature-corrected measurements; dataset for snowfall, snowdepth, and ablation is therefore daily. Albedo and surface temperature data are hourly. |
| Permafrost | Permafrost has not been located at Kilimanjaro summit, despite searches and measurements by a collaborator. |
| Seasonally frozen ground | Continuous ground temperature measurements exist only for a couple years; a collaborator has 1-2 year datasets from 1 m depth at two different locations. |
| Glacier | At AWS, surface height is measured hourly. Data are post-processed using a moving average to remove a residual diurnal cycle in the temperature-corrected measurements; dataset for snowfall, snowdepth, and ablation is therefore daily. Albedo and surface temperature data are hourly. Annual mass balance is derived from above, for only a limited portion of the glacier. Ice thickness determined from ice-core boreholes (n=3) at station and subsequently from surface height change. Area measurements pertain to nearby summit glacier Furtwängler, approx. annually with GPS. Basal ablation observations at multiple, localized points influenced by geothermal heat flux anomalies. |
| Icesheet | Internal layering of Northern Icefield established by multiple GPR profiles (Bohleber et al., 2017) |
| Atmosphere | Measurement intervals vary 10-60 seconds. Most variables recorded hourly; some at 5-min interval. Snowfall is derived from surface height measurement (hourly). Data are post-processed using a moving average to remove a residual diurnal cycle in the temperature-corrected measurements, so most-robust data are daily. Albedo and surface temperature data are hourly. Additional higher-accuracy radiation measurements began 2012 (continuous). |

Kilimanjaro’s ice cap, and its ragged fringe of glaciers flowing down the slopes, began fragmenting early in the 20th century. The Northern Icefield covers the north side of the mountain’s caldera rim, and together with ice which formerly flowed down the northern flanks, it is the largest body of ice on Kilimanjaro. Although the NIF has split into two sections, the southern portion remains the largest body of ice on the mountain, covering 0.51 km2 in 2015 with a mean thickness of ~23 m and maximum of 54 m (Bohleber et al., 2017). For context on the changes underway at the summit, total ice cover on only the plateau portion of the mountain decreased in area by one-third from 2000 to 2011 (Cullen et al., 2013).
The proposed GCW site is situated at approximately the highest point of the NIF, close to the area of maximal thickness. The glacier surface proximal to the AWS (~5 m radius) is flat or very gently sloped (< 4°). Over the past couple decades, the NIF equilibrium line is at an altitude above the glacier and the annual mass balance has been predominantly negative. The cumulative surface height lowering in the AWS area over nearly 18 years is ~ 5 m (Feb. 2000 – Dec. 2017).
The NIF surface is dense glacier ice, except when covered by seasonal snow. On the basis of radiocarbon dating several animals recovered from the glacier surface following prolonged periods of ablation, the upper NIF ice may be nearly 200 years old (P=0.495-0.575). The magnitude and duration of seasonal snowcover varies considerably (e.g., 0.10 to 1+ m); most accumulation occurs during the “long rains” of March-May and the “short rains” of November & December. Seasonal snow is often transformed into superimposed ice, which typically ablates during the extended dry season (June-October), as has been the case since the late 19th century (Meyer, 1891).
To complement AWS measurements, a limited network of ablation stakes on 3 different summit glaciers was established in February 2000, and subsequently expanded in density. Measurements exist over the past 18 years from the NIF, Furtwängler Glacier, and the Southern Icefield (i.e., upper Kersten and Deckens Glaciers). Net ablation has been observed at a total of ~50 sites on an opportunistic basis spanning ~25 different dates; data are not all continuous due to gaps when stakes sometimes ablated out between visits.
Measurements of glacier area from remotely-sensed imagery have been made by others (e.g., Cullen et al., 2013). At the Furtwängler Glacier, this project has conducted near-annual GPS measurements since 2005 to document dramatic shrinkage.