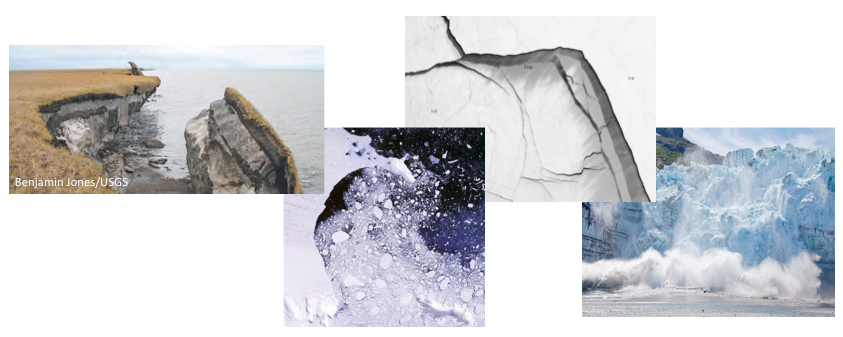
Interesting EventsHere we describe recent, rapid changes in the cryosphere that are newsworthy. They may or may not be significant in a climate context. |
 |
2018 Begins with an Unusually Warm January in the Arctic
Aaron Letterly, 21 February 2018; updated by Rich Dworak and Jeff Key, 18 March
During the opening month of 2018, the Arctic experienced a record low January sea ice extent and is currently at its lowest ever mid-February extent in the satellite record. The Global Cryosphere Watch (GCW) surface temperature tracker shows anomalously high surface skin temperatures in the Arctic for each day in January and continuing into February (Figure 1). These temperatures are an average of all surface temperatures north of 70° latitude, and show consistently high surface temperatures during the time of the year that is critical to sea ice growth and thickening. The record low extent is connected to the extended warming and late ice up in the Beaufort and Chukchi Seas in fall and winter of 2017. Several hot spots of extreme, positive surface temperature anomalies (Figure 2) exacerbated the low January sea ice extent total, which was already trying to recover from one of the latest ice-over dates in the last three decades. The Chukchi Sea, north of Alaska and Kamchatka, experienced exceptionally slow sea ice growth this season and was not fully iced over until December 31, 2017 - only days before it was hit with abnormally high surface temperatures. Anomalies of 10-12°C greater than average stuck around throughout January, affecting the newly-formed ice on the Bering Sea as well as near Svalbard and Novaya Zemlya. As of the time of writing, the Arctic average surface temperature (from 70-90°N) has been more than one standard deviation above average for 46 consecutive days according to the Extended AVHRR Polar Pathfinder (APP-x) dataset.
Figure 1: The GCW Arctic Surface Temperature Tracker shows surface temperature data in red dots throughout January and the first half of February, representing average surface temperatures more than one standard deviation above their 1984-2013 average.
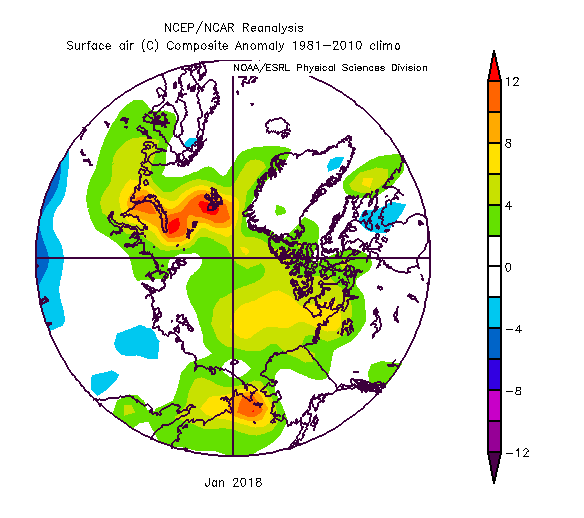
Figure 2: Surface temperature anomaly in January 2018 over the Arctic. Anomaly values are compared to mean values from 1981-2010 over the same months. Data are from NOAA/ESRL, Boulder, CO.
The spatial distribution of surface temperatures over the Arctic during a warming event in February is shown in Figure 3. The JPSS Ice Surface Temperature (IST) product provides a "skin" or radiating temperature of the surface, derived from the Visible Infrared Imaging Radiometer Suite (VIIRS) instrument. Daily composites of VIIRS IST were generated over the Arctic during February 2018. They show multiple surges of warming surface temperature over the region (Figure 3). The first surge of warm surface temperatures occurred over the Barents Sea on February 8 and pushed northward into the central Arctic by February 12. The next surge occurred over the Bering Sea on February 14 and continued into the 20th with the last and most powerful surge of warm ISTs occurring on the 24th over the Greenland and Barents seas, spreading into the central Arctic.
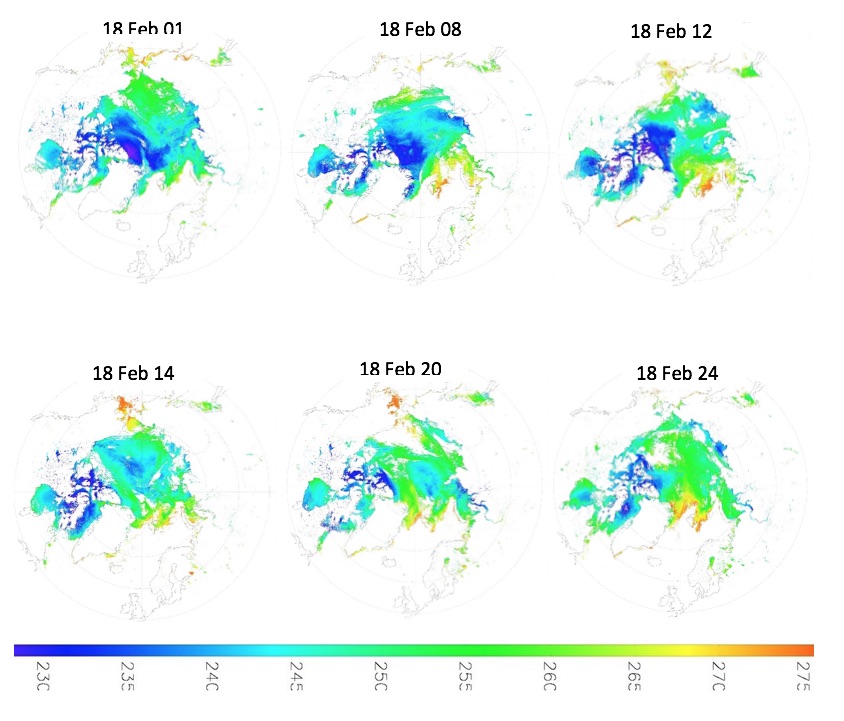
Figure 3: Daily composites of VIIRS IST during February 2018 over the Arctic. From upper-left to lower-right: Feb 01, 08, 12, 14, 20 and 24.
Daily composites over the same region and days during February of last year demonstrate the extreme magnitude of the warmth in 2018 compared to 2017 (Figure 4). Compared qualitatively to the previous year on February 20 and 24 the differences are very large, with ISTs 20-35 K warmer over the central Arctic in 2018.
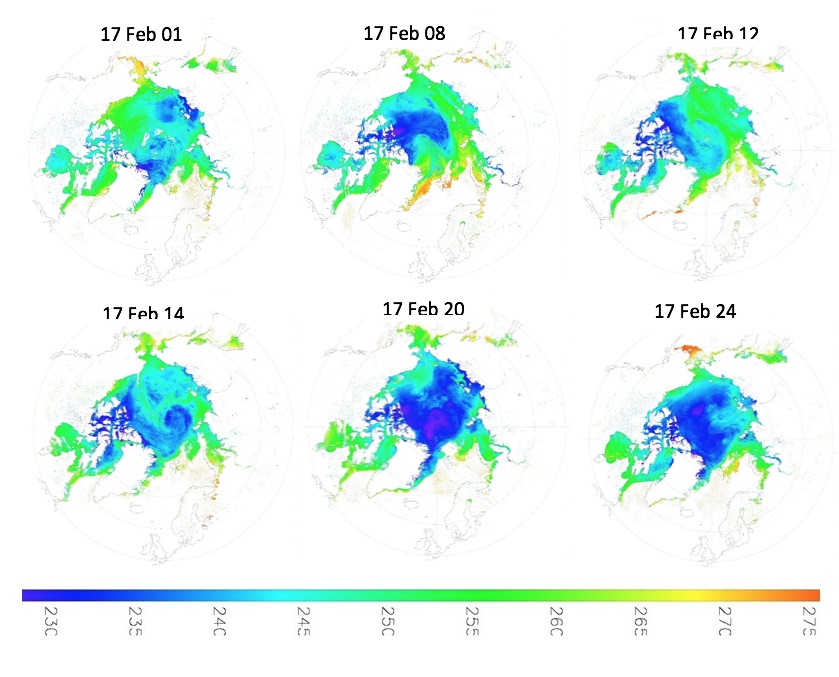
Figure 4: Daily composites of VIIRS IST for same February days in 2017.
References:
NSIDC, 2018: Sea Ice Spatial Comparison Tool, National Snow and Ice Data Center, nsidc.org/arcticseaicenews/sea-ice-comparison-tool/, February 19, 2016.
NSIDC, 2018: Baked Alaska and 2017 in Review, National Snow and Ice Data Center, nsidc.org/arcticseaicenews/2018/01/baked-alaska-and-2017-in-review/.