Sea Ice and Freshwater Ice Assessments |
 |
2023 Sea Ice
Richard Dworak and Jeff Key
15 March 2024
Antarctic Sea Ice Extent Record Lows
Both the European Copernicus Earth observation system and the National Snow and Ice Data Center (NSIDC) reported a record low June Sea Ice Extent (SIE) of 17% below normal (Figure 1) for Antarctica. This is a continuation from the all-time (since 1979) observed record summer minimum SIE that was set in February. According to the National Snow and Ice Data Center (NSIDC, USA), on September 10, Antarctic sea ice reached its annual maximum extent of 16.96 million square kilometers (6.55 million square miles), which is the lowest sea ice maximum for the period 1979-2023.
Figure 2 shows the Sea Ice Concentration (SIC) and associated anomaly for June 2023 compared to average. The average SIC derived from the ERA5 and provided by Copernicus shows that the Sea Ice edge is well below the mean extent, with the main exception being over the Amundsen Sea on the East Pacific side of the Antarctic continent. The most salient negative anomalies are in the Bellingshausen Sea, east Weddell into west King Haakon VII seas and northwest of the Ross Sea (north of Victoria land).
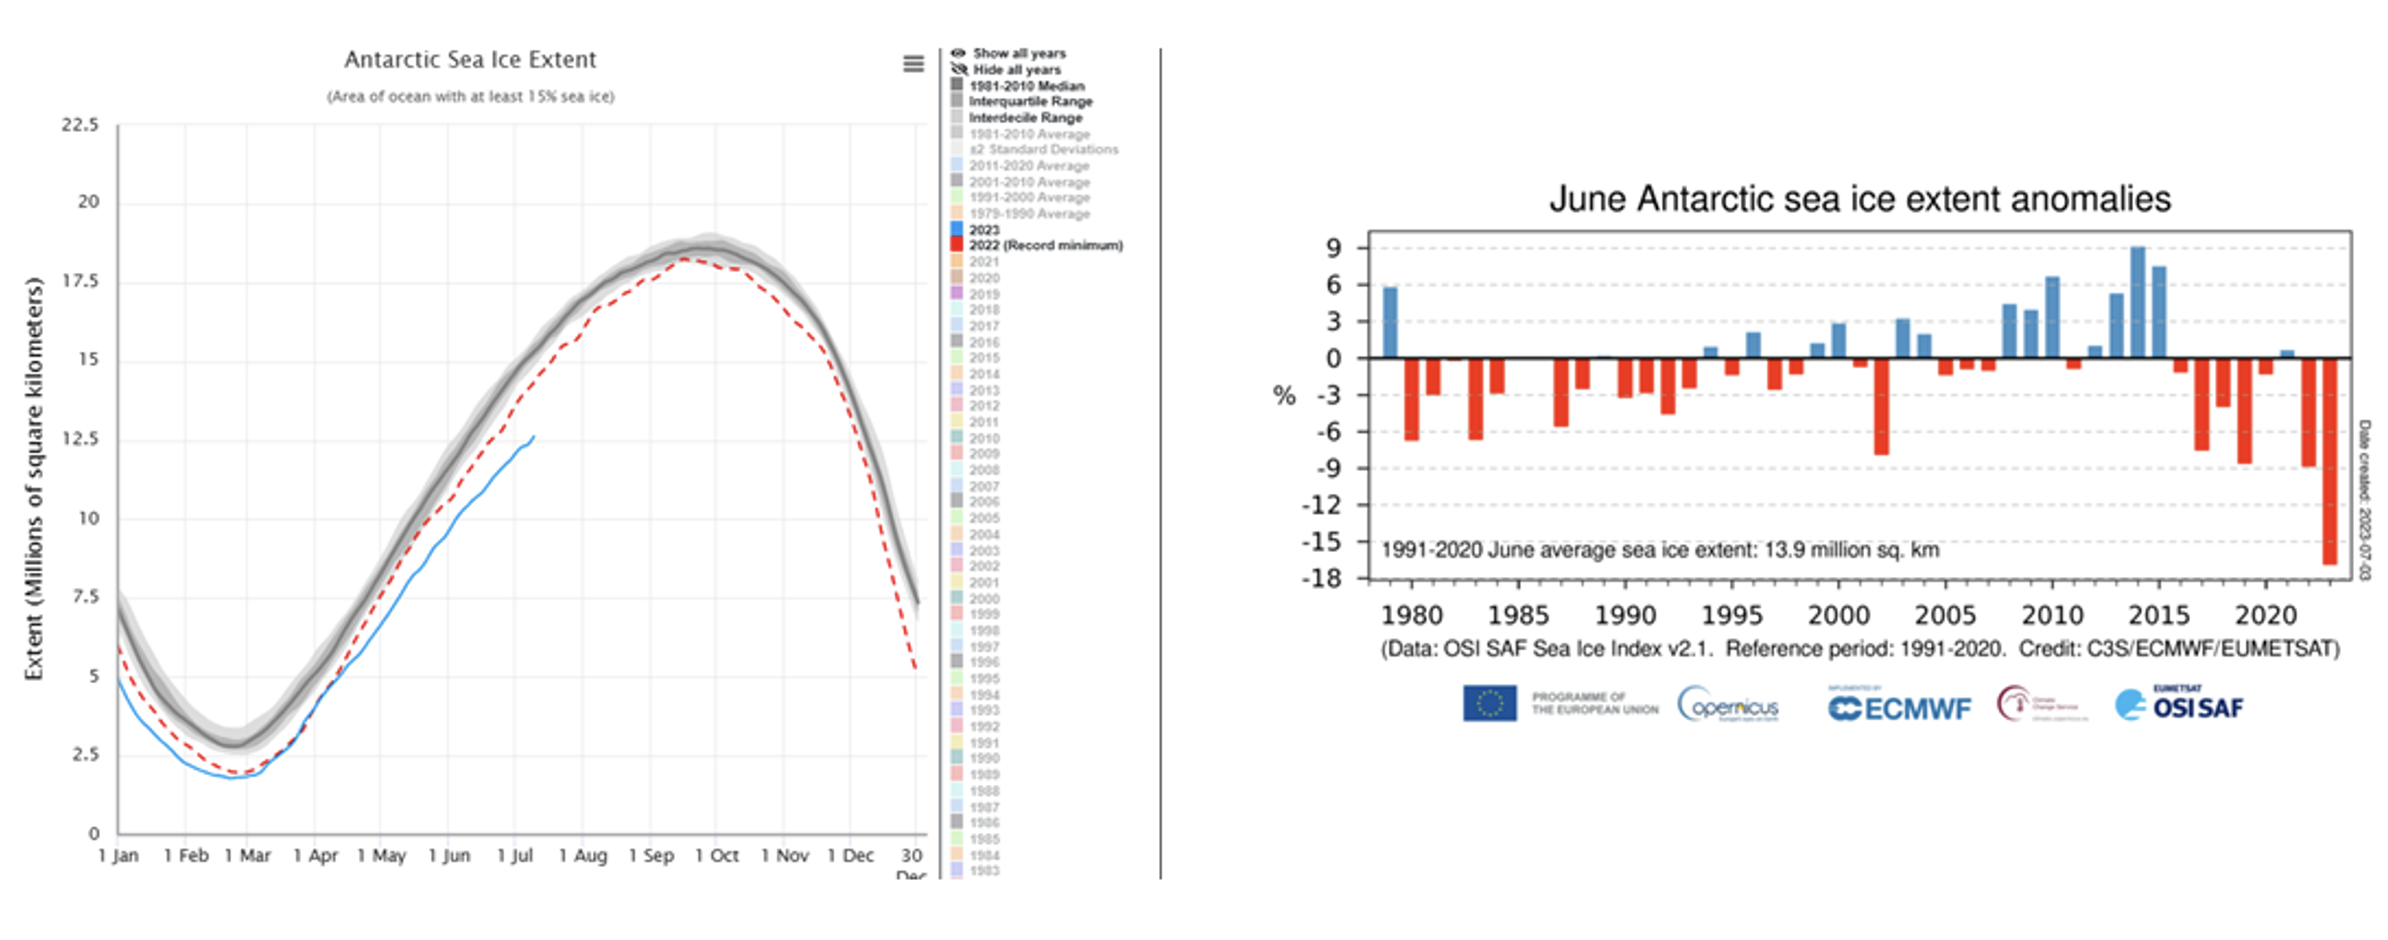
Fig. 1. Left: Daily Antarctic Sea Ice Extent from NSIDC with the black line being the median value, red dashed line being 2022 and cyan being 2023. Right: June ice extent anomalies for each year since 1979 from Copernicus that utilizes the EUMETSAT Ocean Sea Ice Satellite Application Facility (OSI SAF) ice charts.
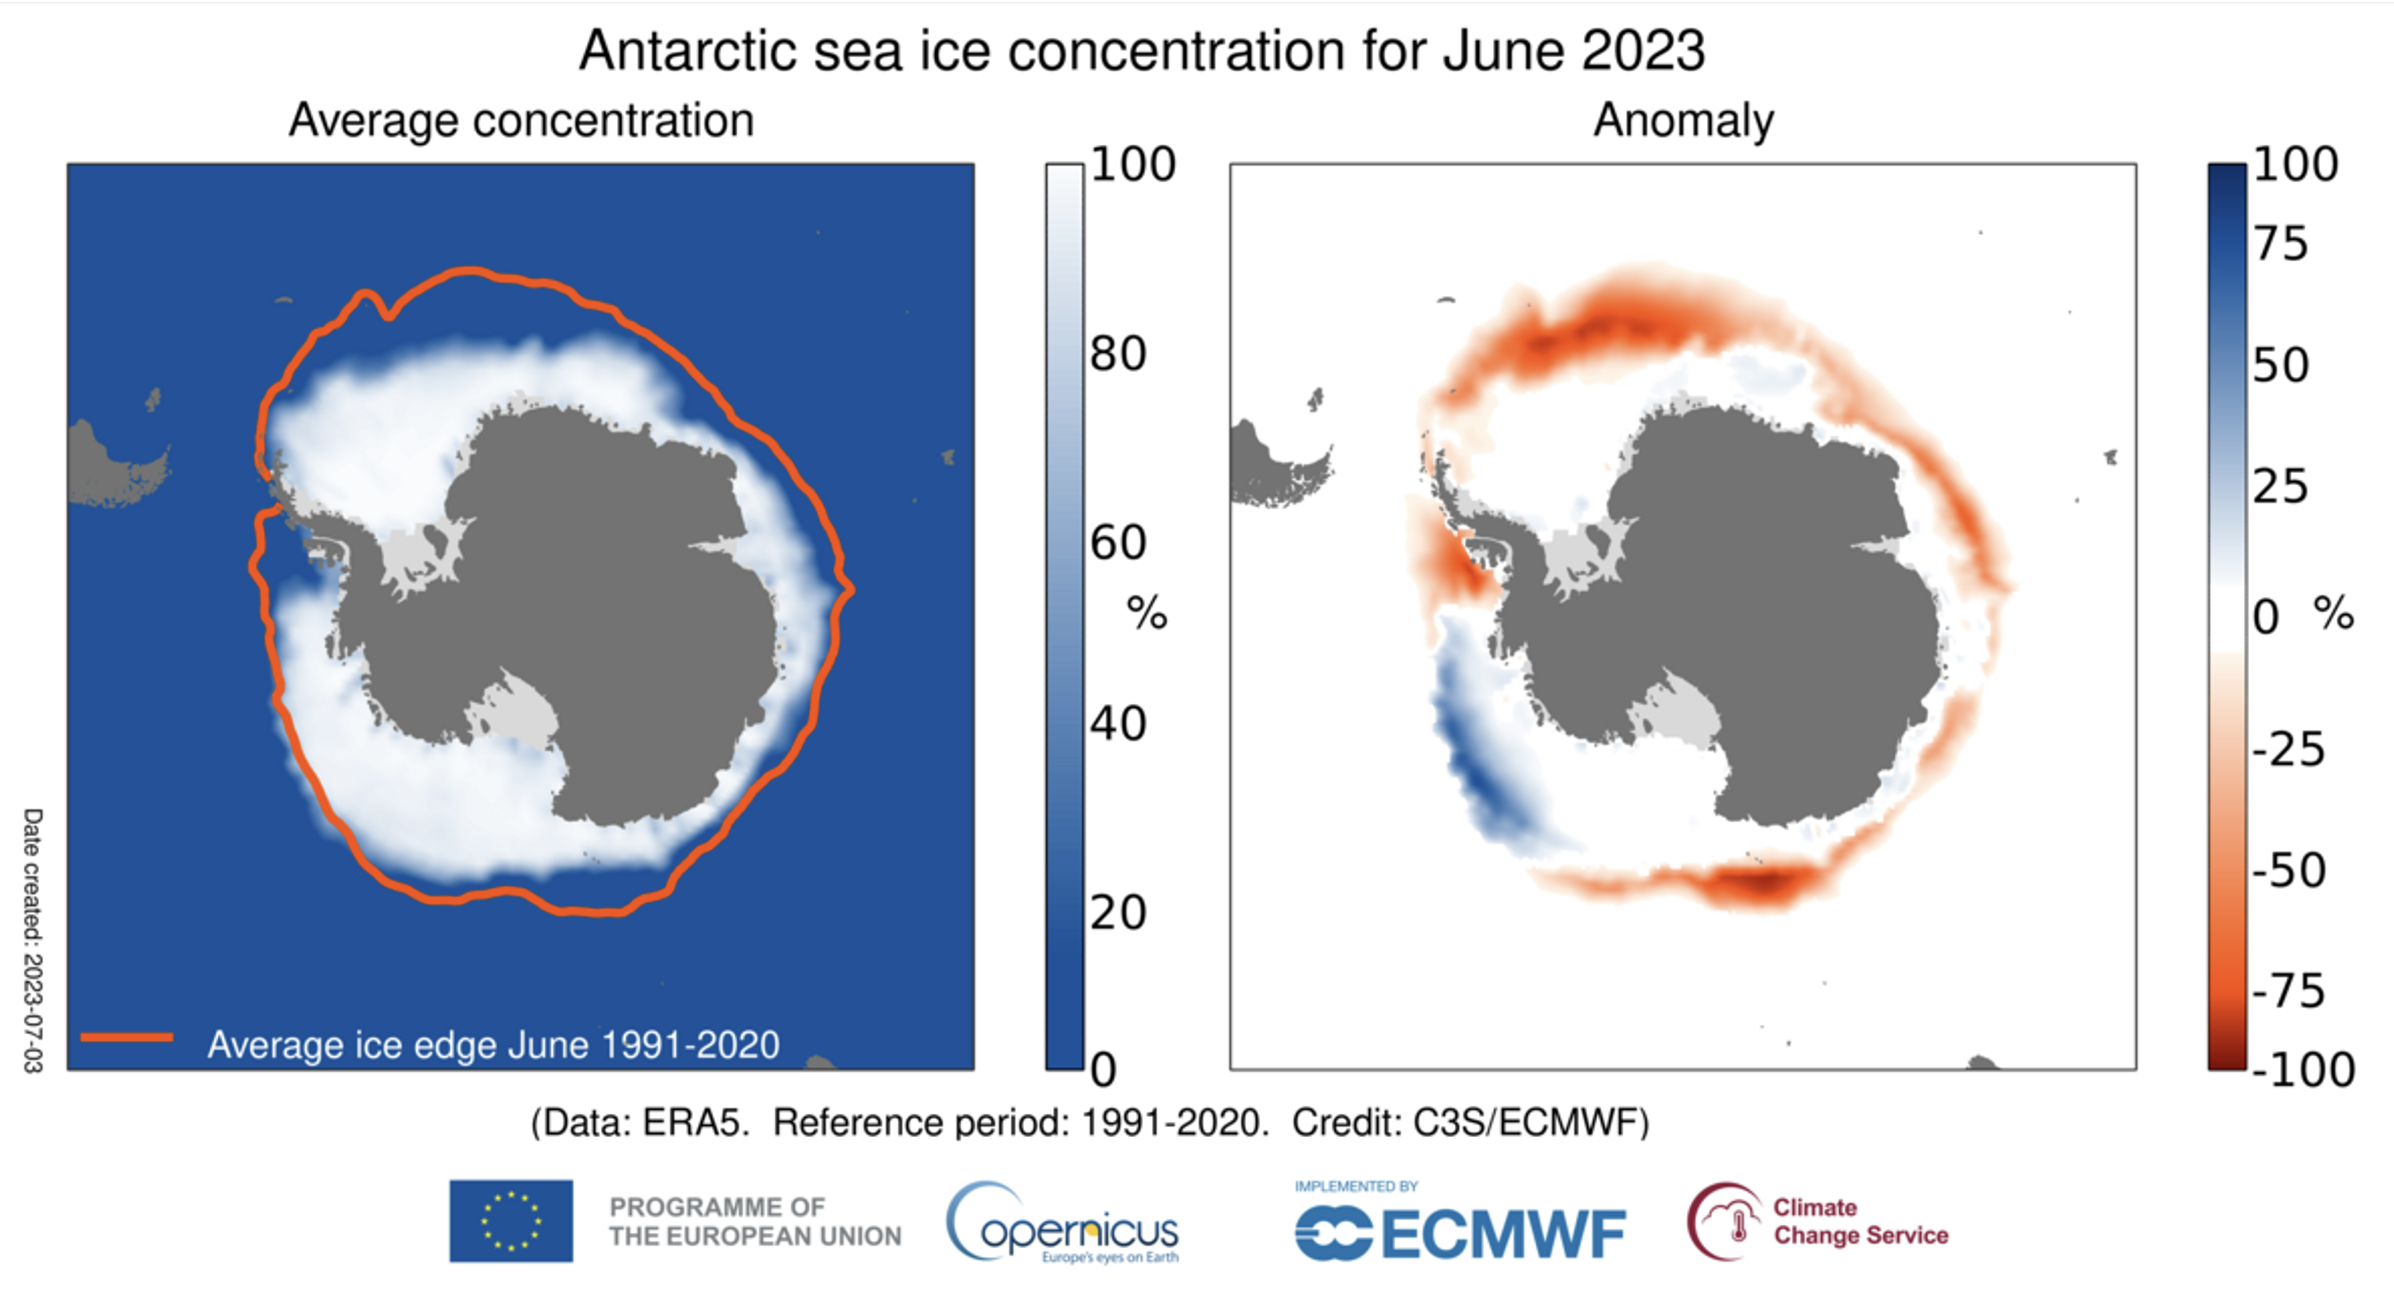
Fig. 2. Left: June average Antarctic SIC from Copernicus derived from ERA5, with the orange line being the 1991-2020 average SIE. Right: The SIC anomaly compared to the average value for the same month, with blue (orange) values being higher (lower) than average.
The NOAA-20 Visible Infrared Imaging Radiometer Suite (VIIRS) monthly SIC for June 2023 and a comparison to the previous year is shown in Figure 3. The year 2022 was also below average, however, only about half as much lower than what was observed in 2023. As to be expected, SIC visually matches well to what is observed in Figure 2. For example, both show SIC much lower than 90% in the Bellingshausen Sea. Overall, there are matching spatial patterns along the sea ice edge between VIIRS and ERA5. Even though anomaly comparisons in Figures 2 and 3 are different, with Figure 2 being compared to 1991-2020 average (reference period) and Figure 3 being compared to previous year, the anomalies match well with each other. The VIIRS June 2023 minus 2022 difference SIC has a smaller positive anomaly compared to the reference period over the Amundsen Sea. Furthermore, the 2023-2022 difference is slightly positive, while being slightly negative in the reference comparison plot on the Indian Ocean side of the Antarctic. Both anomaly plots point to low SIC anomalies in the Bellingshausen, east/west Weddell/King Haakon VII seas and region northwest of Ross Sea. These are the main areas driving the record low SIE/SIC for June 2023. Quantitatively, the mean SIC in 2023 was 7% lower in 2023, with 90.3% mean SIC in 2023 versus 97.3% in 2022. The histogram anomaly plot of SIE in Figure 1 confirms these results as the value in 2022 was -9% compared to -17%, about 8% lower in 2023.
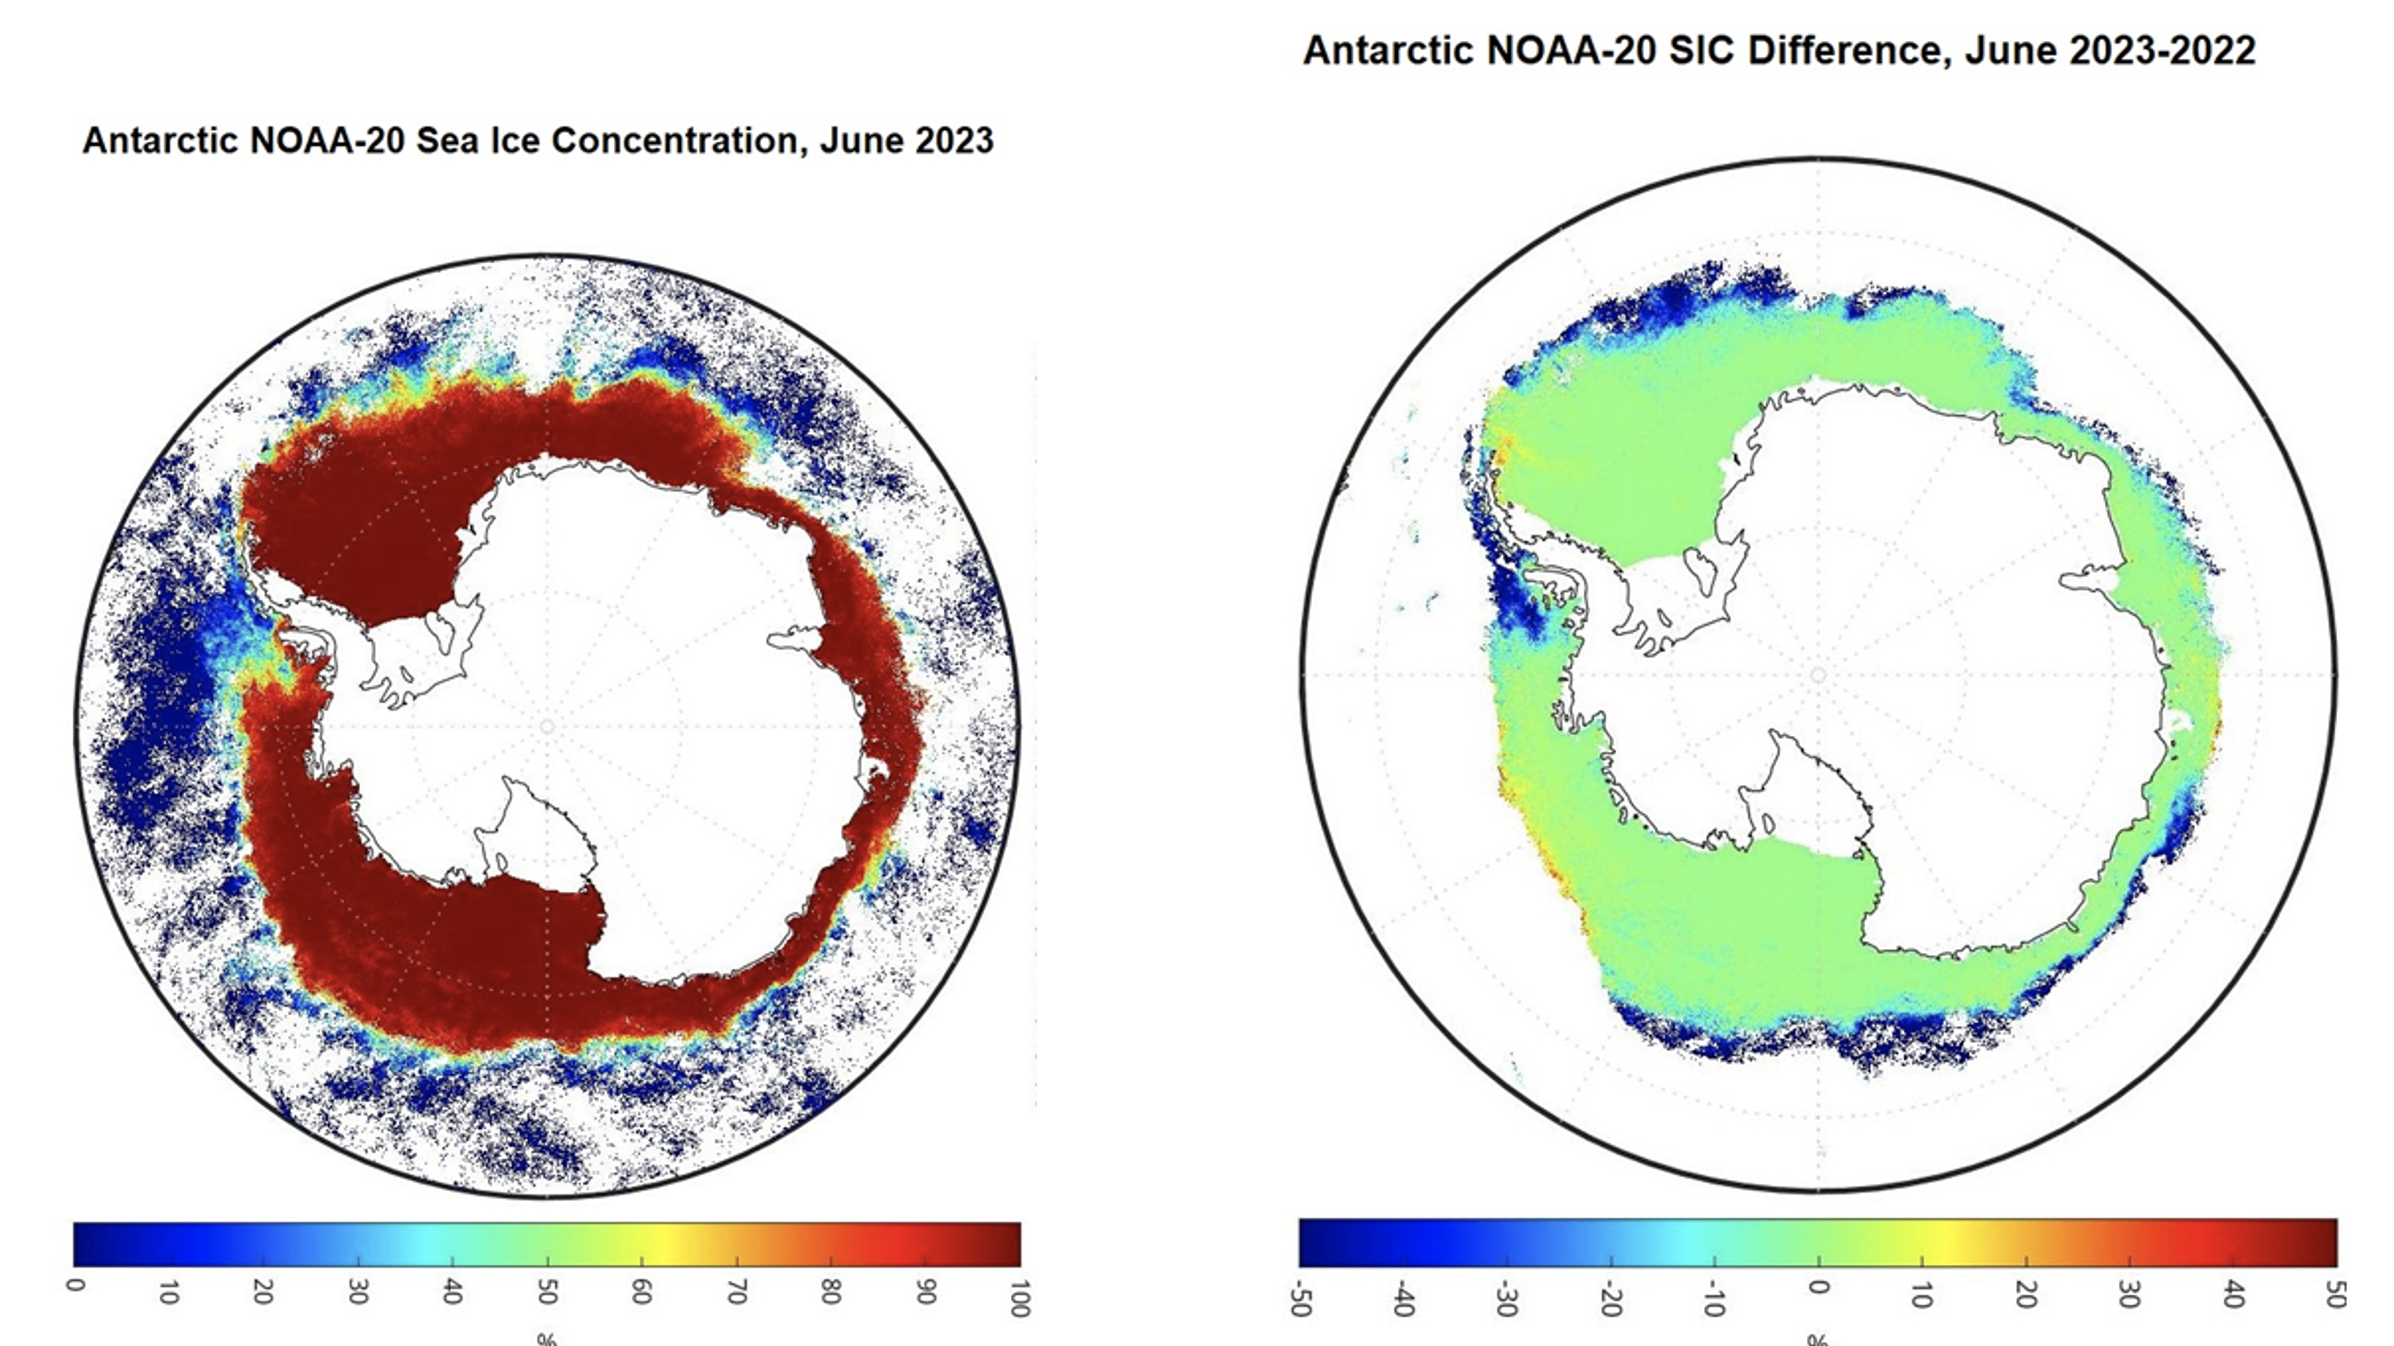
Fig. 3. Left: NOAA-20 VIIRS June 2023 average SIC (clear sky only). Blue (red) colors represent low (high) concentration. Right: June 2023 minus June 2022 SIC difference with blue (red) colors representing lower (higher) SIC in 2023. Green represents near zero change.
The mean Ice Surface Temperature (IST) derived from NOAA-20 VIIRS for June 2023, and a comparison to the same product from the previous year, are shown in Figure 4. As to be expected, there is a good correlation between the very warm IST anomalies (8-10+ K) and the very low SIC anomalies (≤ -40%) in Figure 3. For example, the 6-10 K positive IST anomaly in the Amundsen Sea is associated with a 30-50% negative SIC anomaly. The larger negative IST anomalies (-6 to -8 K) are associated with slightly positive to net zero SIC anomalies. Net zero SIC anomalies are likely 100% SIC that existed in both 2023 and 2022. The two largest negative difference areas in IST (Bellingshausen Sea and western Weddell Sea) have slight positive difference in SIC of about 10-25%. The overall mean IST in 2023 was 255.2 K compared to 254.2 in 2022, a 1 K warmer sea ice this year compared to last over the Antarctic.
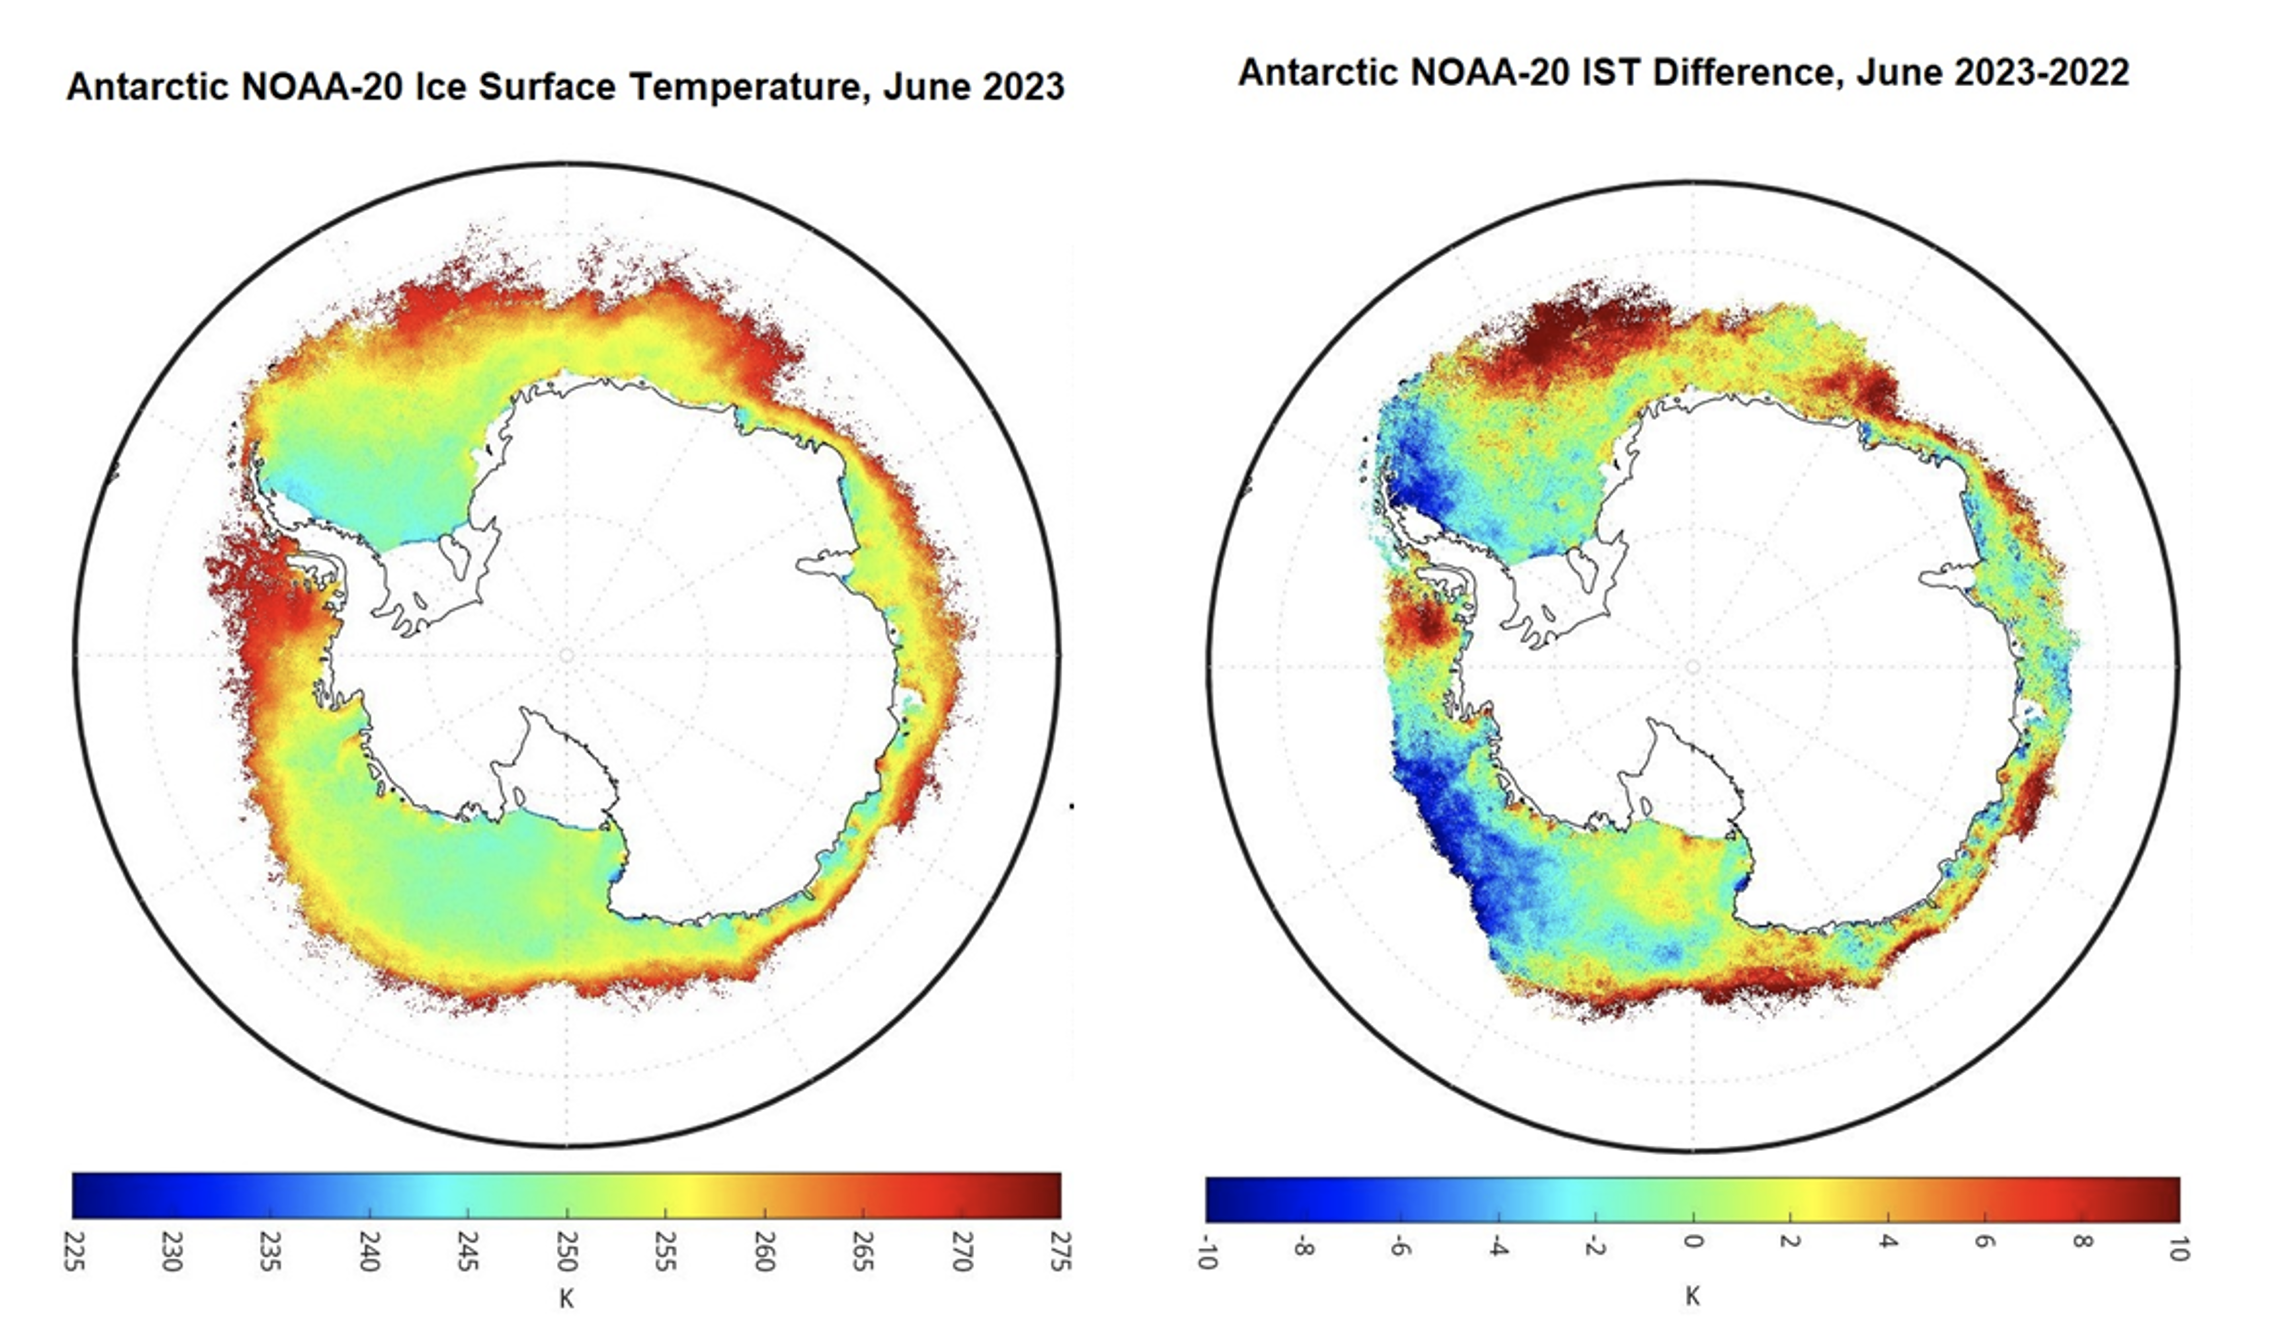
Fig. 4. Left: NOAA-20 VIIRS June 2023 average IST from clear sky only. Blue (red) colors represent relatively cold (warm) temperatures. Right: June 2023 minus June 2022 difference with blue (red) colors represents colder (warmer) 2023 IST Green color represents near zero change.
In summary, based on results from NSIDC and OSI SAF, June 2023 had the lowest SIE on record for the Antarctic. Visual results show that NOAA-20 VIIRS June 2023 mean SIC compares well to ERA5, with similar patterns in the sea ice edge especially. The anomaly plot for June 2023 SIC from ERA5 minus the 1991-2020 mean compares well with year to year (2023-2022) SIC differences from VIIRS. Most notable is the agreement on the location of large negative differences in the Bellingshausen Sea, west/east Weddell/King Haakon VII seas and northwest of the Ross Sea. Lastly, it was found that large positive temperature differences were associated with large negative SIC anomalies, as expected.
Arctic Sea Ice
The minimum Arctic sea ice extent in 2023 occurred on 19 September, with a September average of 4.37 million km2 (1.69 million km2). Figure 5 puts the 2023 minimum in the context of the last four decades. It was the sixth lowest sea ice extent in the satellite record, from 1979 to the present. The downward trend continues. The Northwest Passage was largely open, as shown in Figure 6.
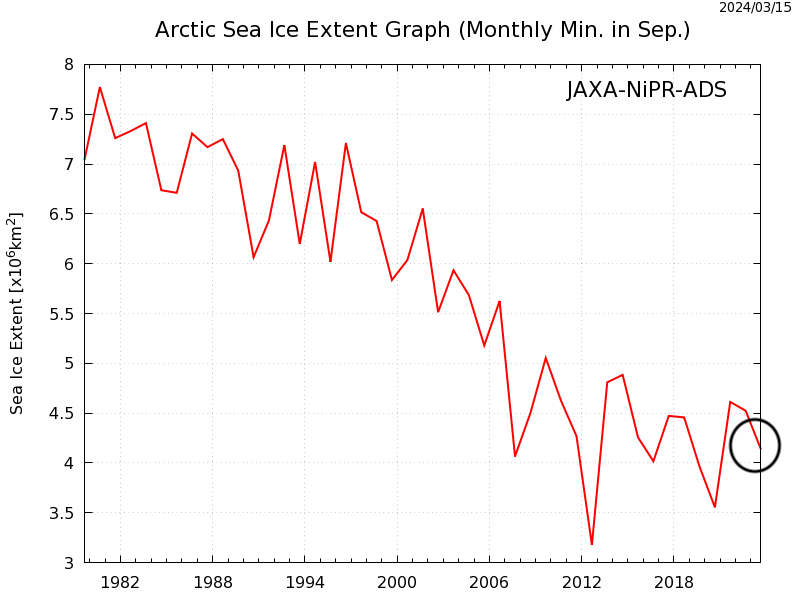
Fig. 5. Time series of annual minimun Arctic sea ice extent in September through 2023 (circled). (From JAXA-NiPR-ADS)
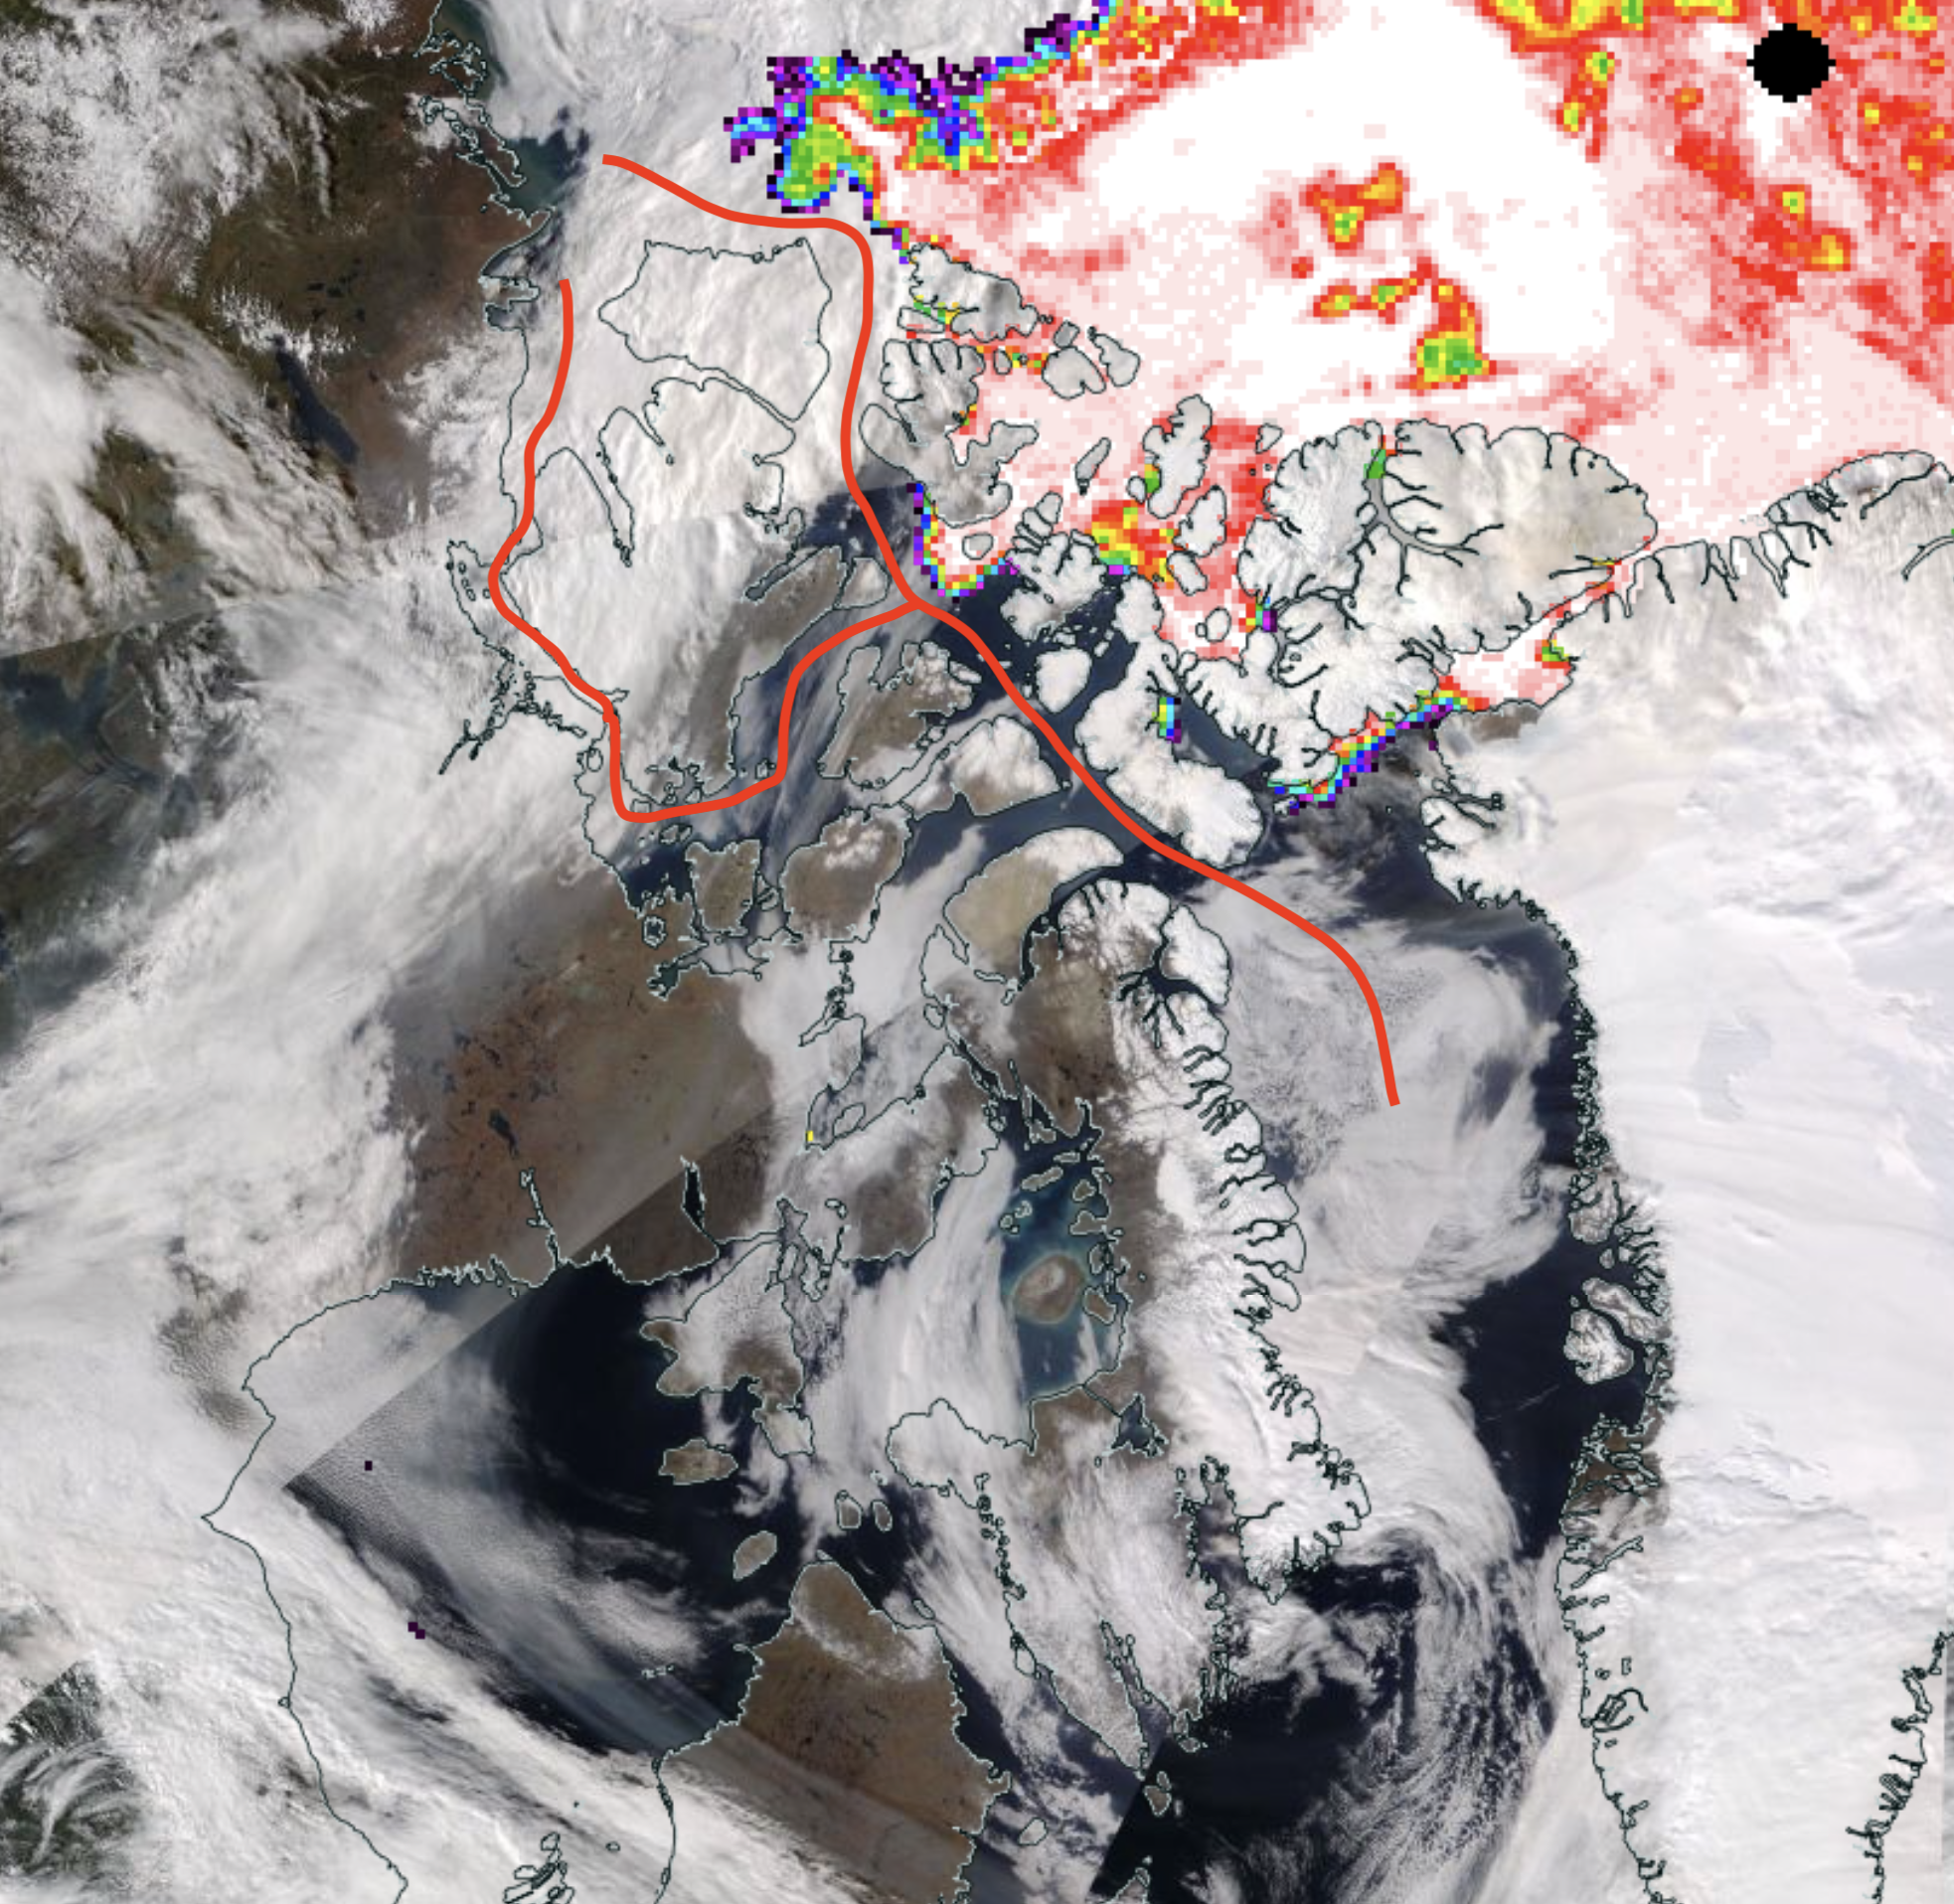
Fig. 6. NOAA-20 VIIRS true color image with AMSR2 ice concentration (colors) on 15 September 2023 over the Canadian Arctic Archipelago and the Northwest Passage. The AMSR2 ice concentration identifies areas of ice. The date was chosen for its relatively low cloud amount, though extensive cloud cover is present on the western side of the Archipelago and in some of the channels between islands. Greenland is on the right; the North Pole is in the upper right. Two potential routes through the Northwest Passage are shown; others have also been used. (From NASA's Worldview)