Snow Assessments |
 |
2019 Snow Assessment
Ross Brown (ECCC) and Patricia de Rosnay (ECMWF)
28 February 2019, updated 17 July 2019
Northern Hemisphere Snow Cover, August 2018 - February 2019
Snow cover onset: Anomalies of August 2018 - January 2019 snow cover duration (SCD) from the Canadian Meteorological Centre (CMC) operational snow depth analysis (from in situ observations) and the NOAA Interactive Multisensor Snow and Ice Mapping System (IMS24) daily snow cover analysis (from mainly satellite data) are in good agreement (Figure 1). The main features are: (1) earlier onset of snow cover over most of eastern North America, central Europe and the Tibetan Plateau, and (2) much later than normal snow cover onset over northern China, and slightly later than normal onset over a large region covering most of eastern Eurasia and western North America. The late start to the snow season was an initial concern for the California snowpack but this has since reached 100% from late January storms. Early winter snow cover was below normal in the European Alps causing a slow start to the ski season and disruption of World Cup ski events.
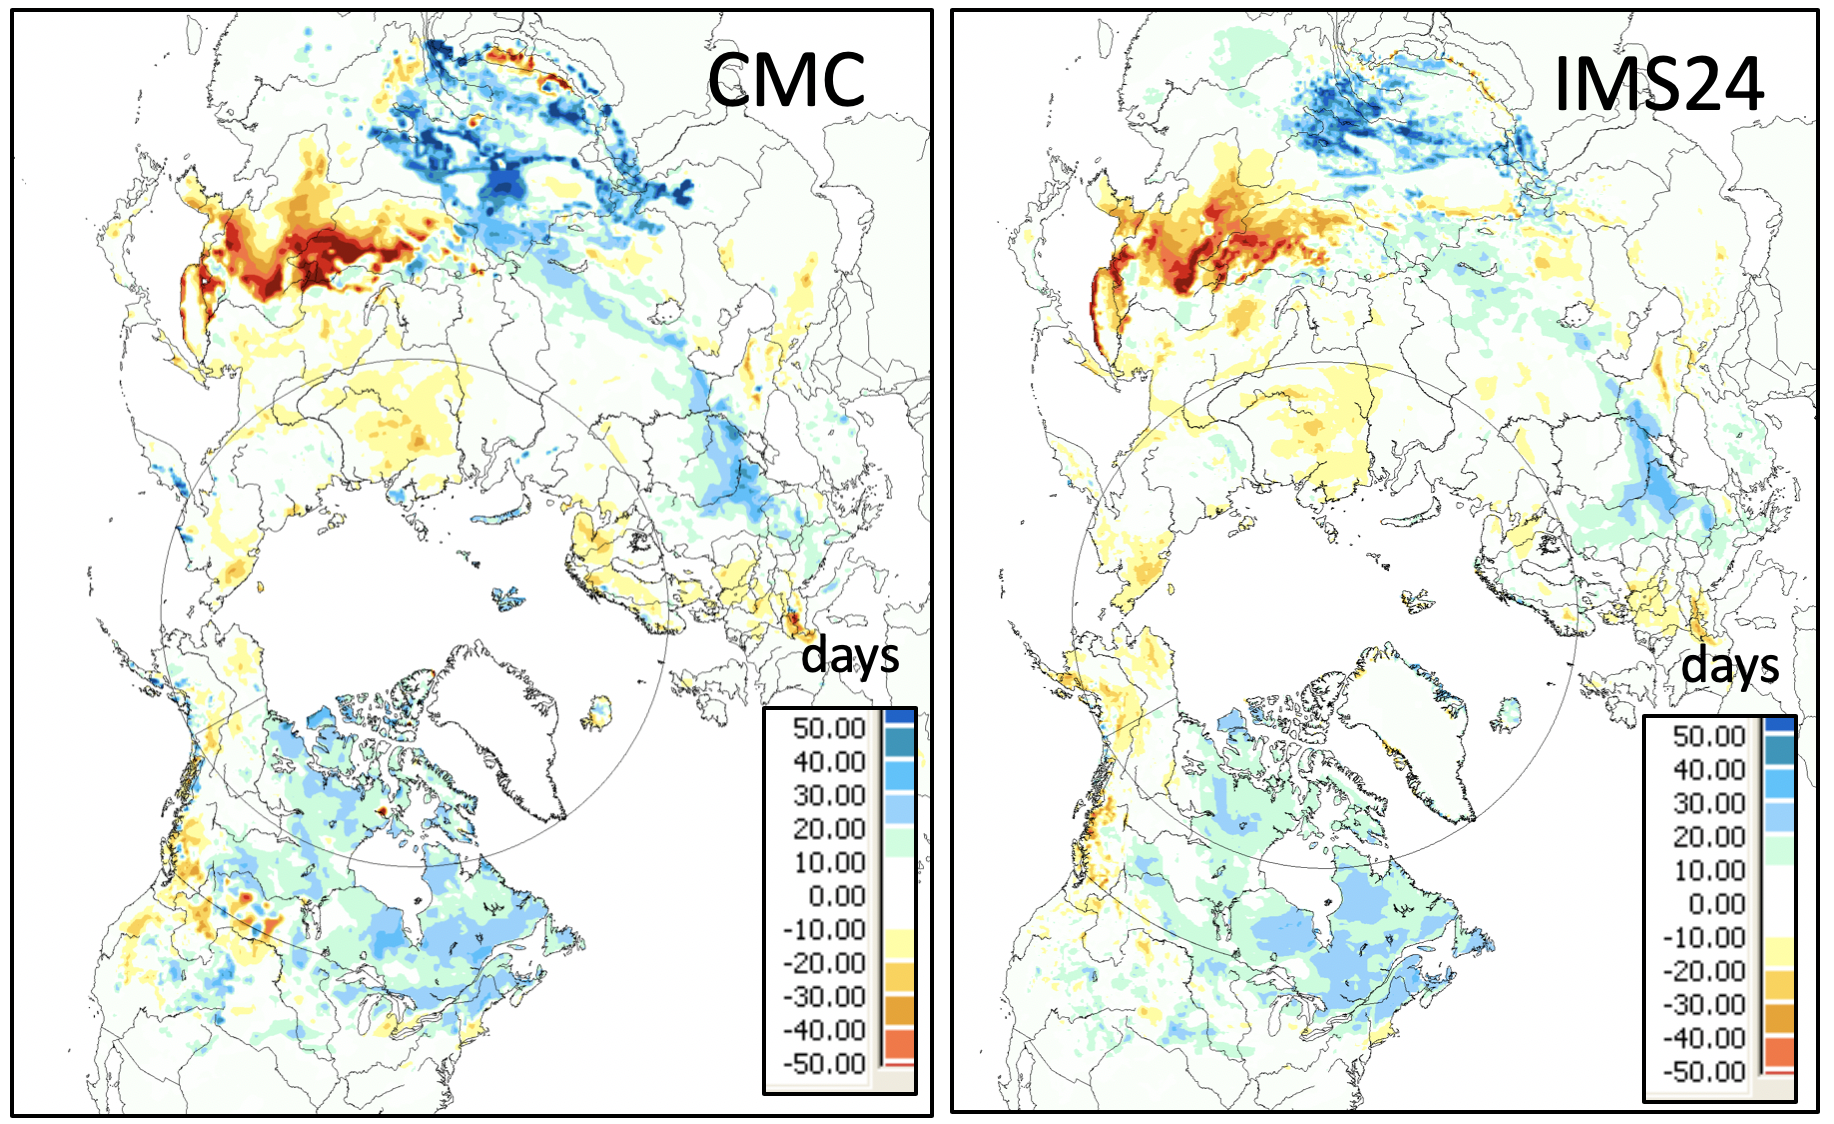
Figure 1: Difference in August-January snow cover duration (days) between 2018-2019 season and the 1998-2017 average for the CMC operational snow depth analysis (left) and the NOAA IMS24 daily snow cover analysis (right).
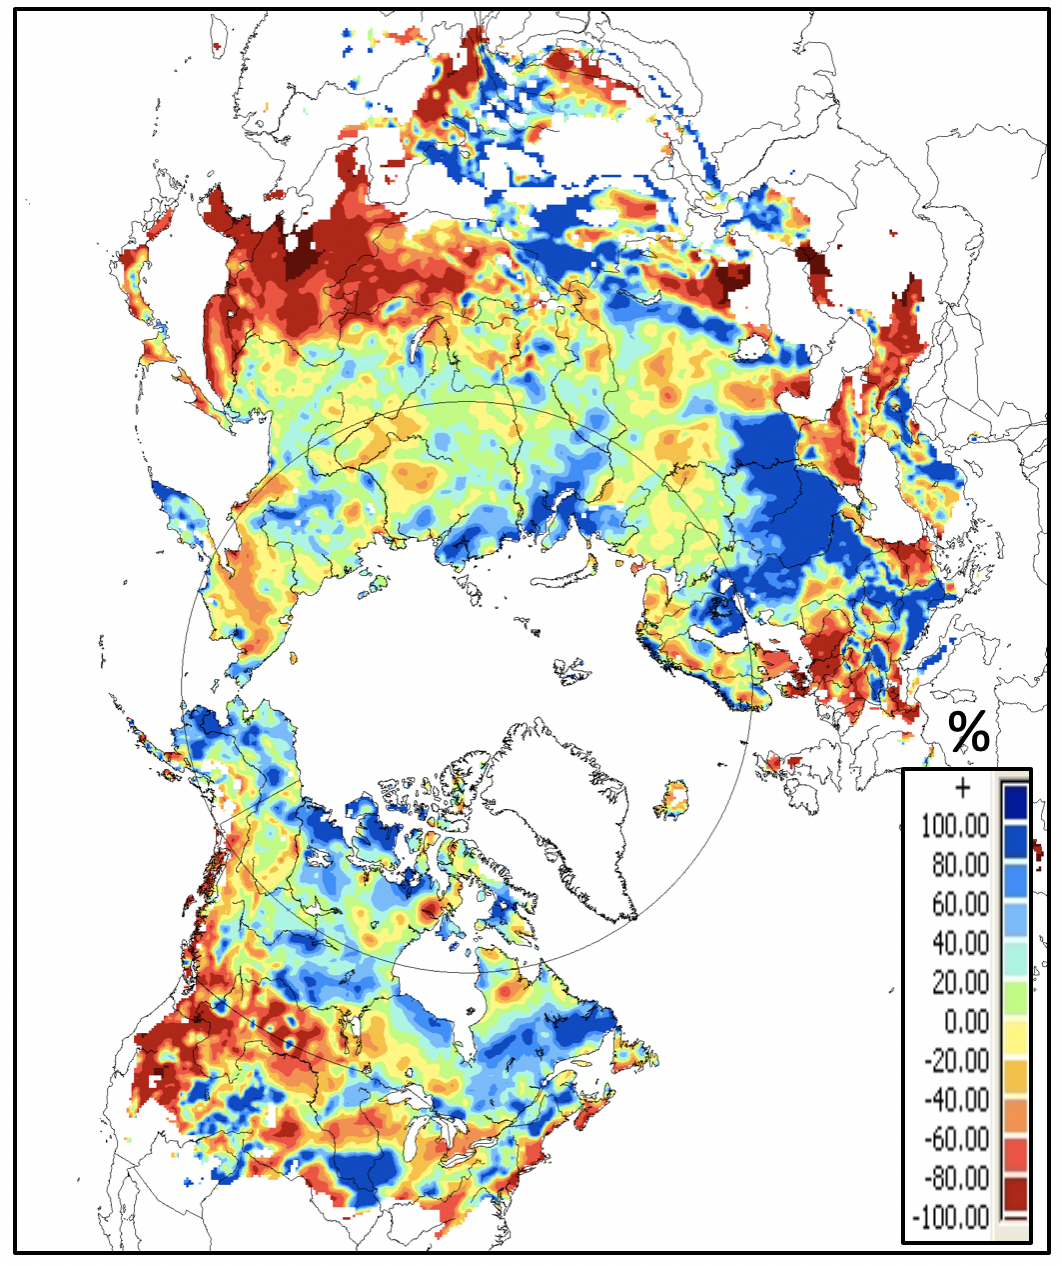
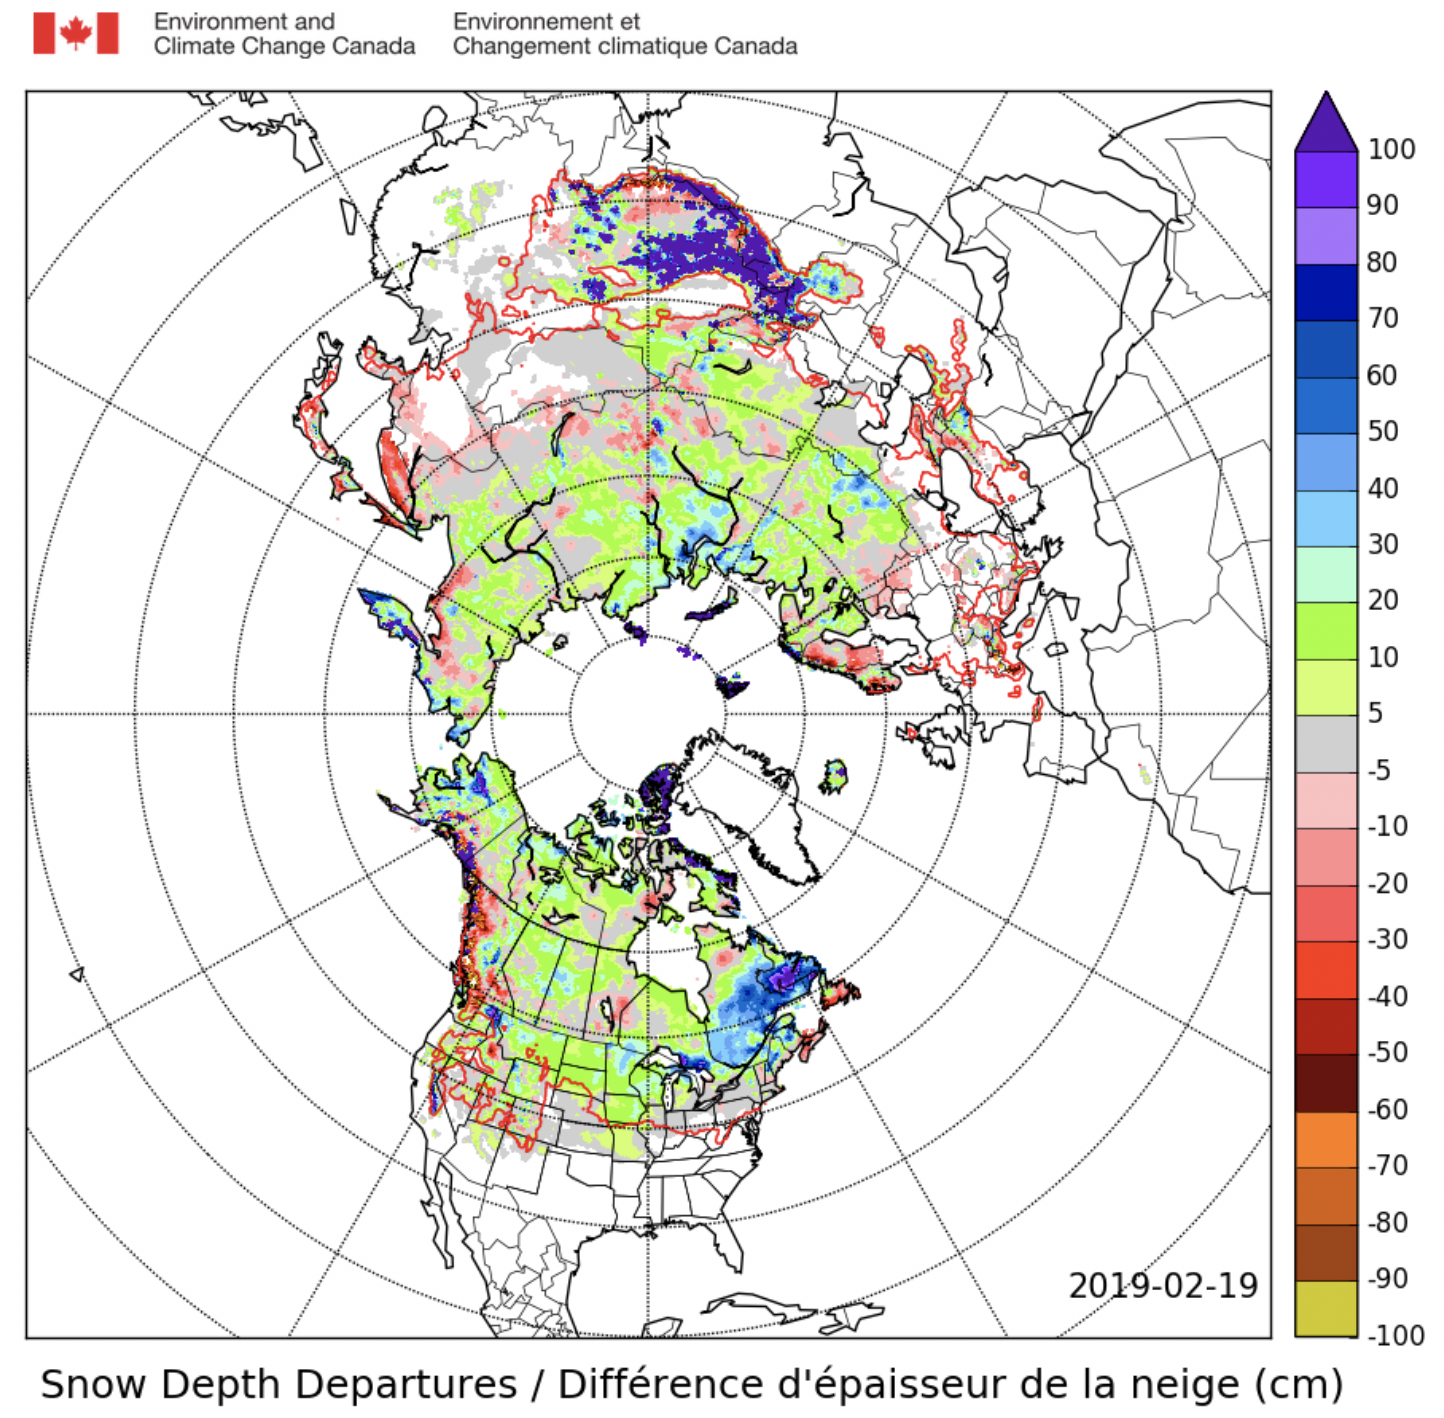
Winter snow accumulation: Anomalies of January mean snow depth from the CMC operational analysis are more or less consistent with the onset anomalies indicating above-average snow depths over regions with early onset (most of Canada and large areas of Europe) and below-average snow depth over northern China and western North America (Figure 2). Unusually cold and heavy snowfalls in early January across large regions of North America and Europe made headlines with several deaths attributed to heavy snowfall and avalanches in parts of Europe. Heavy snowfalls in 2019 over both continents have contributed to predominantly positive snow depth anomalies as of 19 February (Figure 3) with noticeably deeper than normal snow accumulations over Quebec and Labrador, and over parts of the Tibetan Plateau. Heavy snow and rain in Quebec have contributed to a number of roof collapses.
Figure 2: Difference (%) between January 2019 mean snow depth and the 1998-2017 average for the CMC operational snow depth analysis. |
Figure 3: Snow depth departures (cm) from CMC operational daily snow depth analysis for 19 February 2019 versus the average value over snow seasons 1998/99 through 2011/12. |
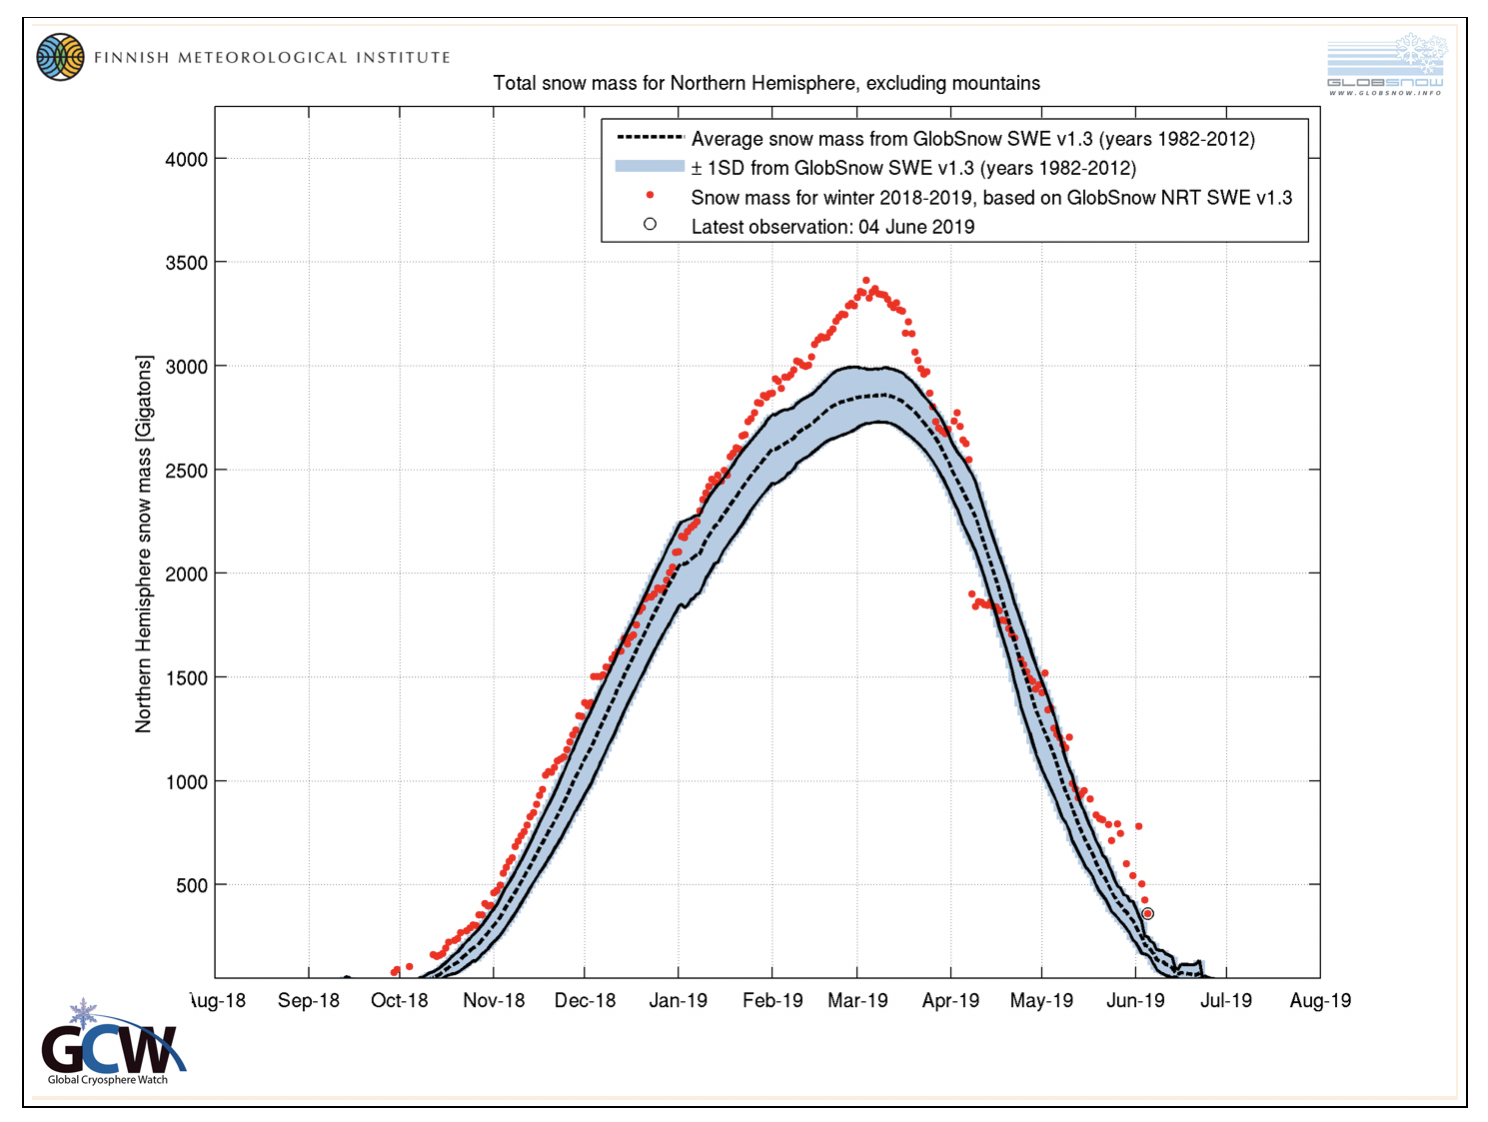
Hemispheric-averaged anomalies: The GCW snow anomaly tracking products from CMC and GlobSnow (Figures 4 and 5) show that 2018-2019 season snow cover extent has been close to normal but snow water equivalent (SWE) is running substantially above average. This follows the pattern of previous years which saw above-normal SWE followed by rapid spring melt. The higher SWE values obtained by CMC are partly related to masking out of mountain regions in the GlobSnow product.
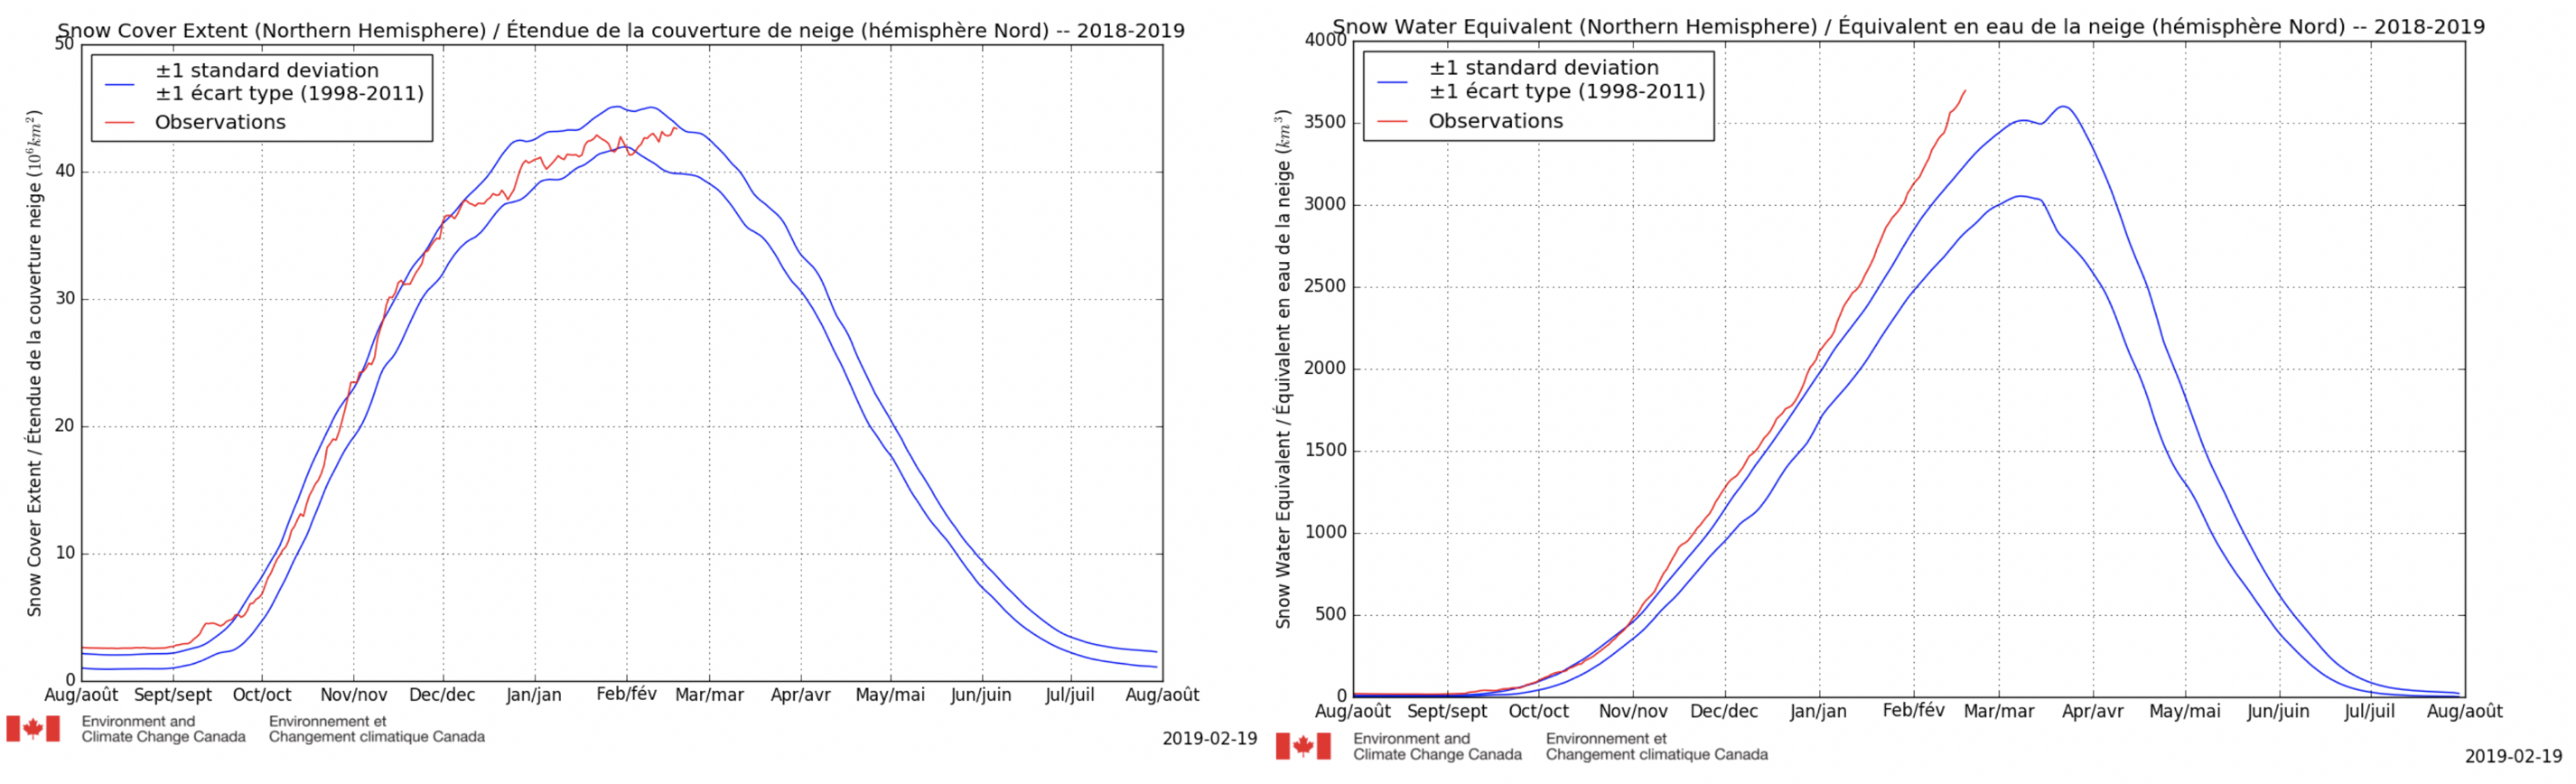
Figure 4: 2018-2019 snow season history of Northern Hemisphere land area snow cover extent (left) and snow water equivalent (right) compared to ±1 standard deviations about the 1998/99 to 2011/12 average from the CMC operational snow analysis.
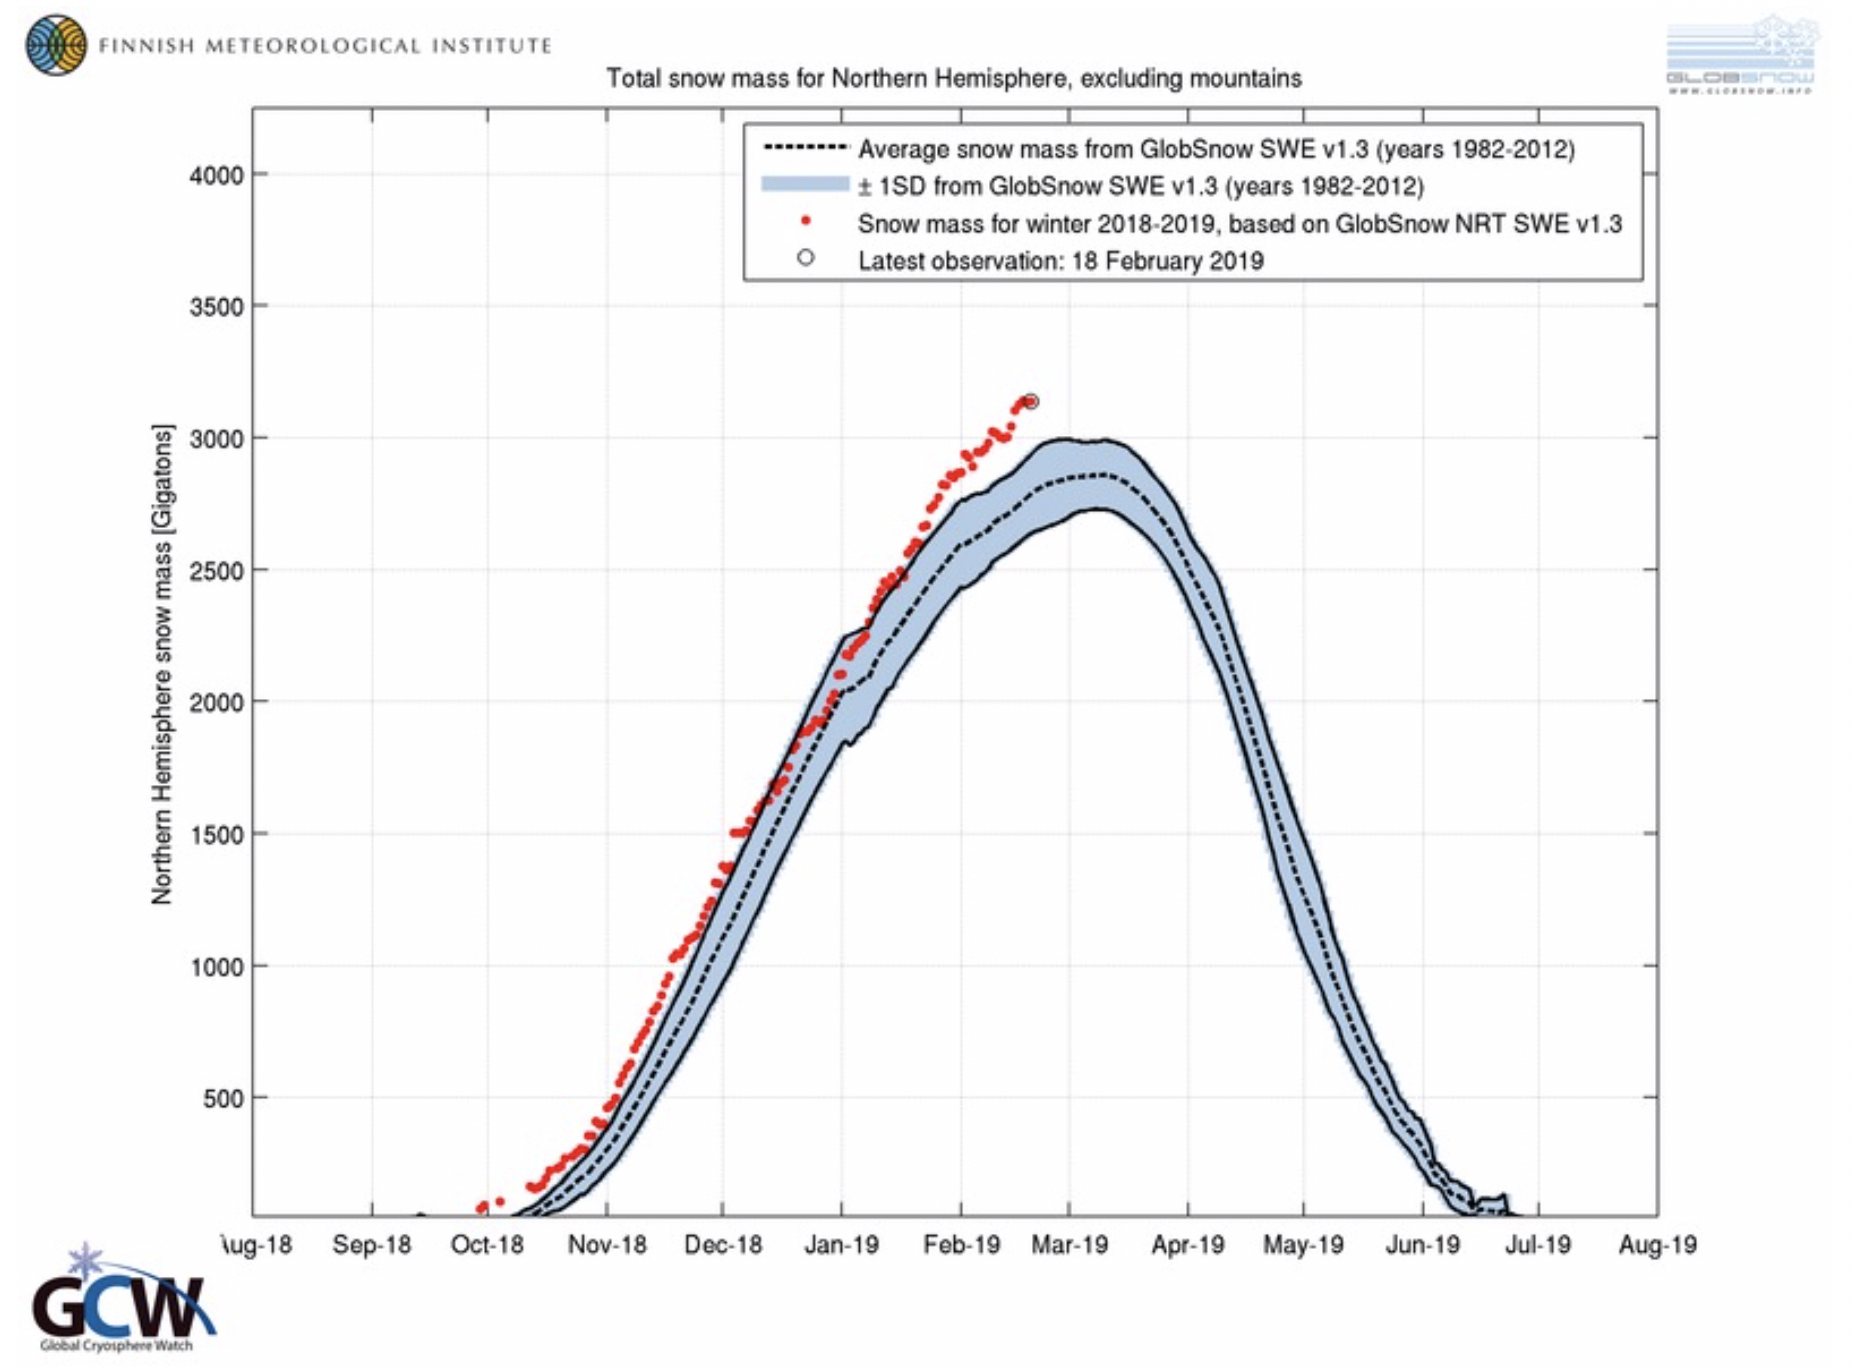
Figure 5: 2018-2019 snow season history of Northern Hemisphere land area (excluding mountains) snow water equivalent compared to ±1 standard deviations about the 1988 to 2012 average, from the GlobSnow Product.
Northern Hemisphere Spring 2019 Snow Cover
Spring snow cover duration: Anomalies of January-June snow cover duration (SCD) from the CMC operational snow depth analysis (from in situ observations) and the IMS24 daily snow cover analysis (from mainly satellite data) are in good agreement (Figure 6). The main features are longer than average spring snow cover over central Asia and much of the USA and eastern Canada, and below-average snow cover over Korea and northern China. Most of Europe also had below-average spring snow cover in spite of unseasonably cold spring temperatures. The Arctic had near normal spring snow cover over most of the region with the exception of the Yukon and southeastern Alaska area where spring snow cover was 20-30 days below normal. At the hemispheric scale, June snow cover extent was approximately 1.5 standard deviations below the 1981-2010 reference period in the NOAA climate data record (CDR) product. NH spring (April, May, June) snow cover extent has decreased significantly (0.05 level of significance) over the period 1972-2019 at a rate of 0.865 million km2 per decade, or -5.1% per decade with respect to (as a percentage of) the 1981-2010 reference period average (Figure 7).
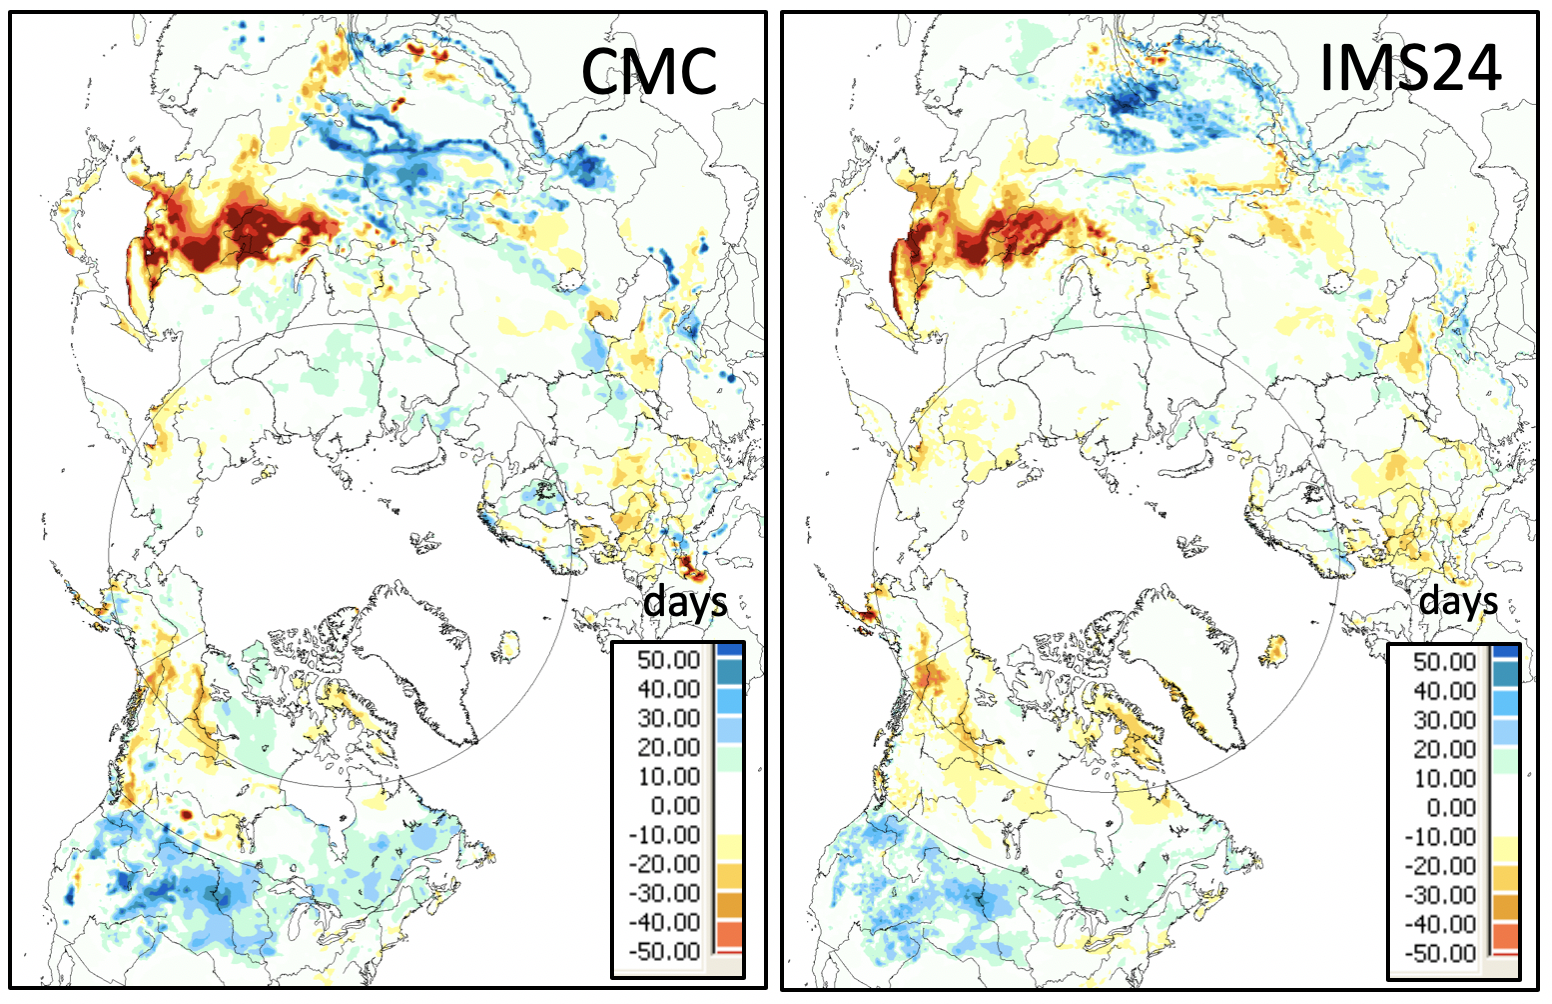
Figure 6: Difference in January-June snow cover duration (days) between 2019 and the 1998-2017 average for the CMC operational snow depth analysis (left) and the NOAA IMS24 daily snow cover analysis (right).
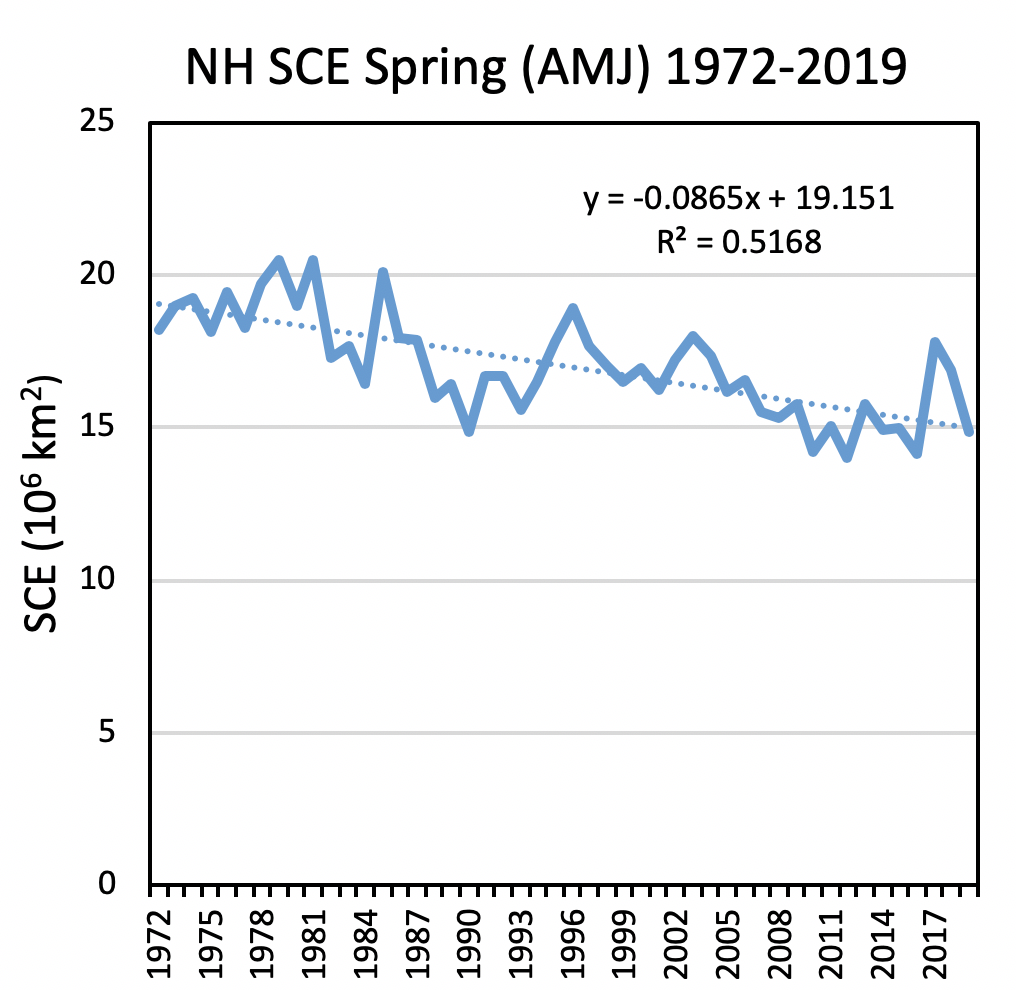
Figure 7: NH land area (excluding Greenland) spring (April, May, June) snow cover extent variability over 1972-2019 from the NOAA-CDR snow product at Rutgers University. The 2019 June SCE value of 3.63 million km2 was 1.48 standard deviations below the 1981-2010 reference period average.
March snow accumulation: Anomalies of March mean snow depth (the month of maximum snow accumulation over the NH) from the CMC operational analysis are more or less consistent with the spring SCD anomalies indicating above-average snow depths over central USA and eastern Canada, and below-average snow depths over Europe, China, Korea and Japan (Figure 8). March snowpack average snow water equivalent (SWE) over southern Quebec was 75 mm above normal, the third highest March SWE in the past 57 years of the historical record. The above average spring snowpack combined with heavy spring rainfall contributed to extensive flooding across the Great Plains and in the Ottawa and Montreal regions.
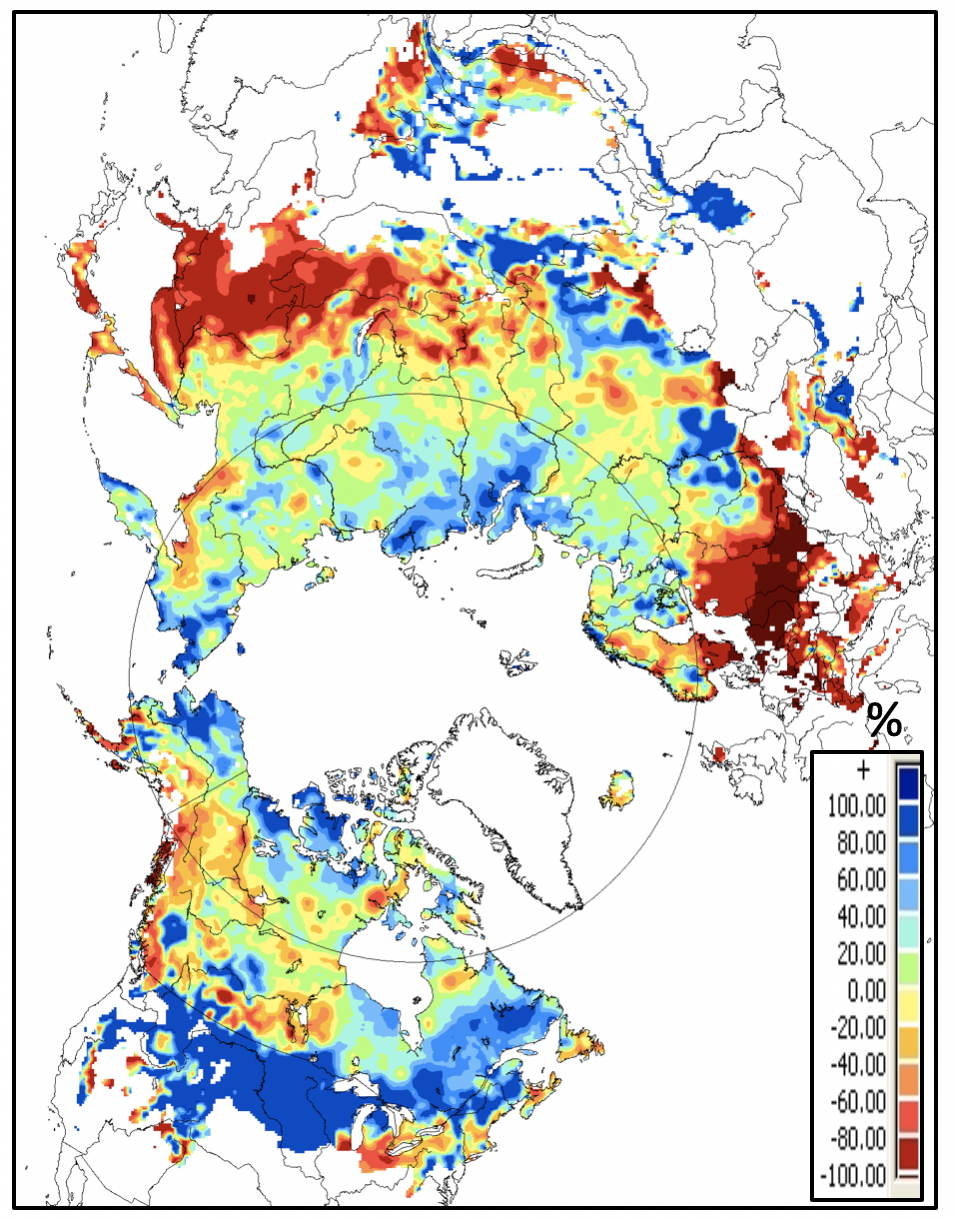
Figure 8: Difference (%) between March 2019 mean snow depth and the 1998-2017 average from the CMC operational daily snow depth analysis. Anomalies are capped at ± 100%.
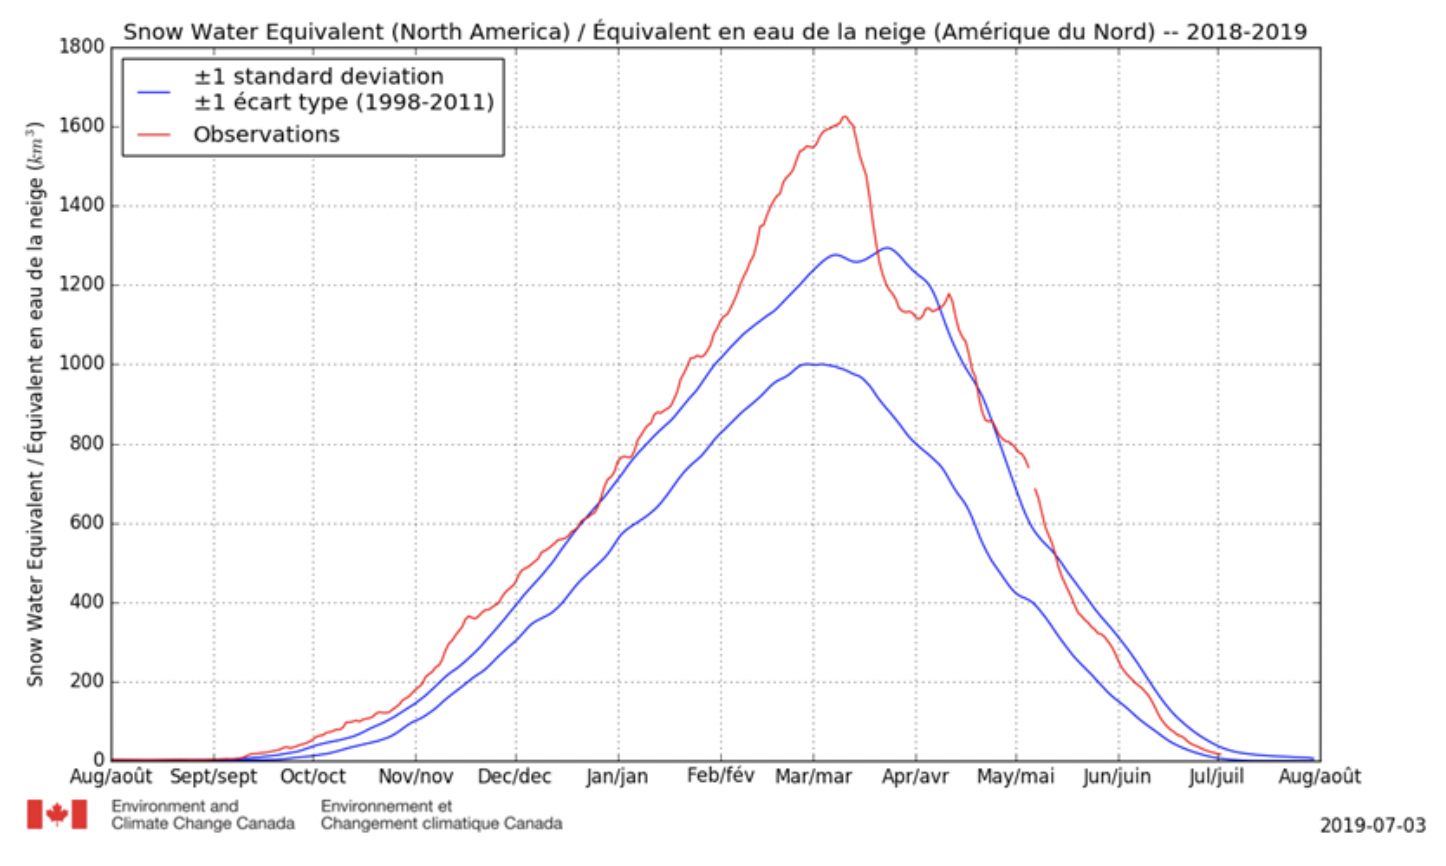
Snow season history: The GCW NH snow anomaly tracking products from CMC and GlobSnow (Figures 9 and 10) show that 2018-2019 snow cover extent was close to normal but the peak SWE was substantially above-average, particularly over North America (see https://ccin.ca/ccw/snow/current for CMC tracker results for North America and Eurasia). North American SWE was also characterized by very rapid melt in March (Figure 11) that contributed to widespread flooding across the U.S. Midwest.
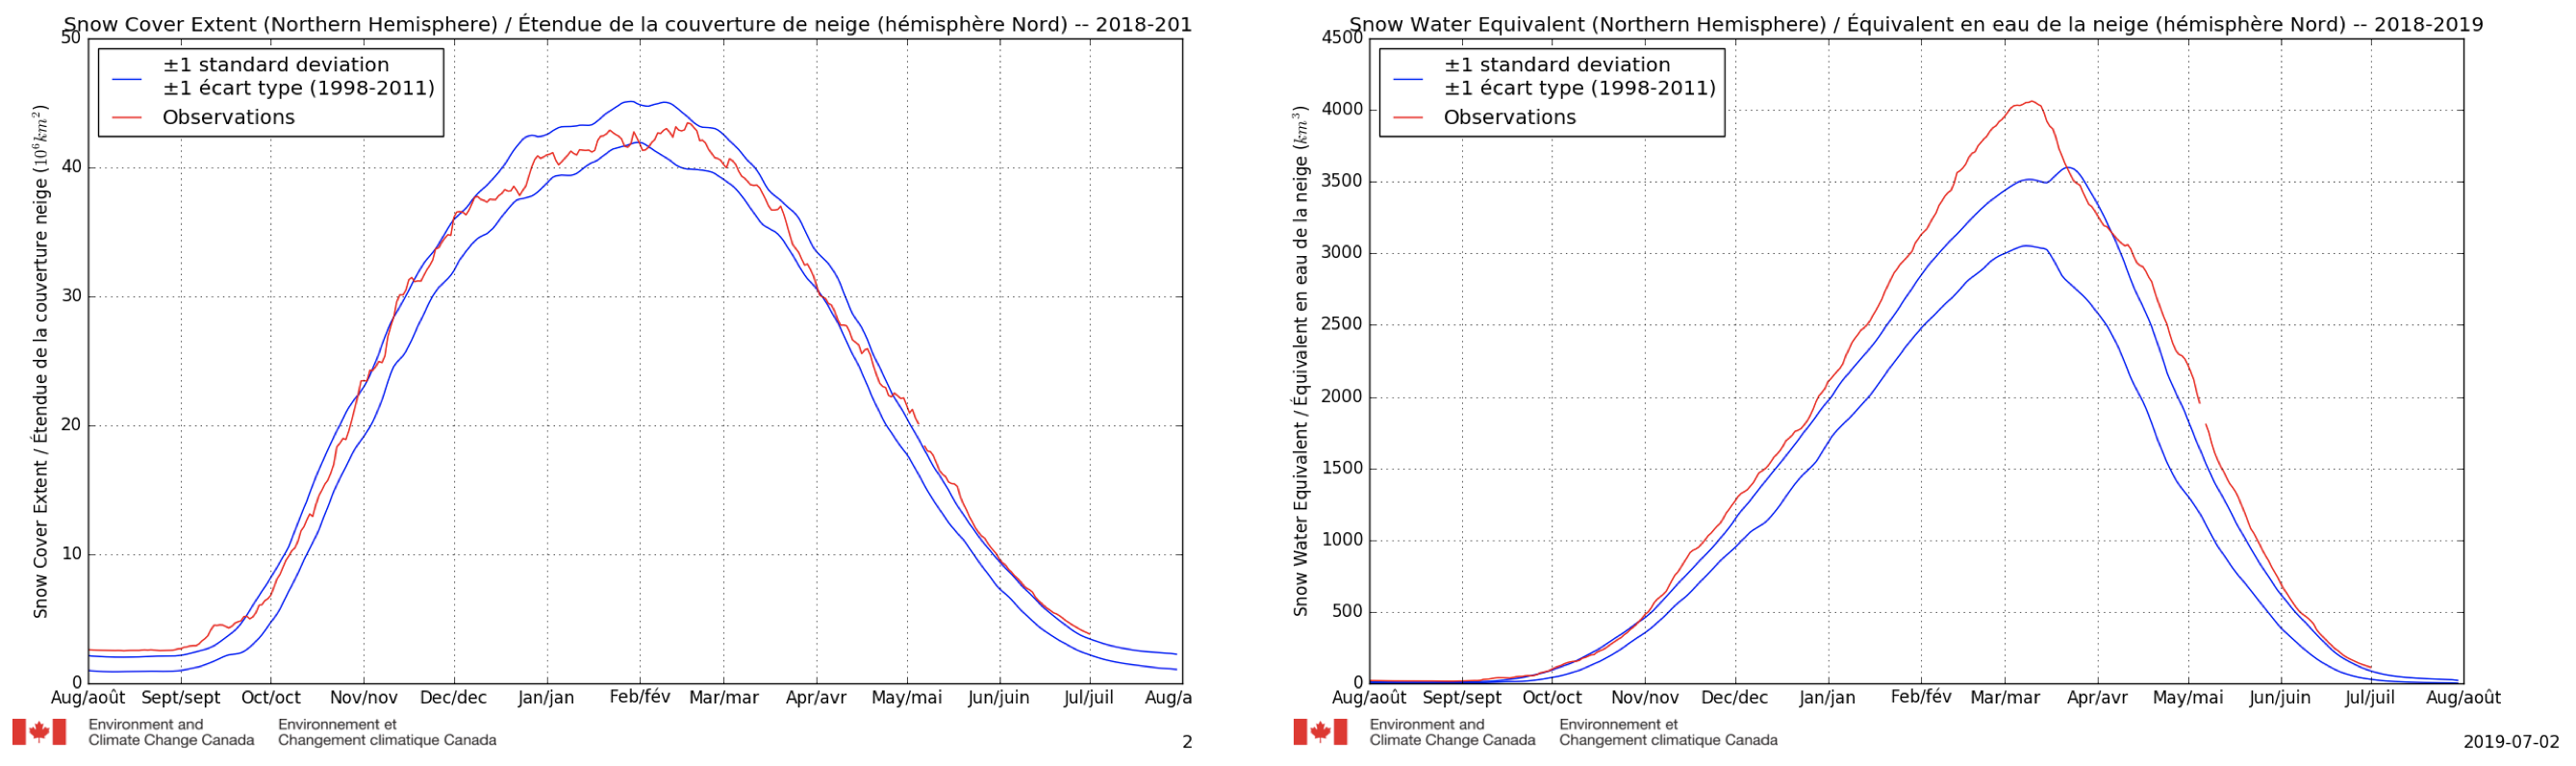
Figure 9: 2018-2019 snow season history for Northern Hemisphere land area snow cover extent (left) and snow water equivalent (right) compared to ±1 standard deviations about the 1998/99 to 2011/12 average from the CMC operational daily snow depth analysis.
Figure 10: 2018-2019 snow season history of Northern Hemisphere land area (excluding mountains) snow water equivalent compared to ±1 standard deviations about the 1988-2012 average, from the GlobSnow Product. |
Figure 11: Seasonal variation in North American total snow water storage estimated from the CMC operational daily snow depth analysis. |
Snow in the News
- U.S. snowpack coverage at one of its lowest levels for early January in the past decade (weather.com, 8 January 2019)
- Over 100 Ski Resorts Now Open in Europe But More Snow Is Needed (Unofficial Networks, 5 December 2018).
- Heavy snow, extreme cold in parts of North America (CTV, 4 January 2019)
- Snow and freezing temperatures hit Naples (EXPRESS, 4 January 2019)
- Heavy snow in parts of Europe result in several deaths and causes disruption (BBC video, 10 January 2019)
- Roofs collapse across Quebec after province struck by heavy snow, rain (Global News, 17 February 2019) Avalanche hits hotel as parts of Europe are snowed under (BBC News, 15 January 2019)
- Blizzards and low temperatures kill thousands of herd animals in Tibet (Independent)
- Why there is no snow in Beijing this winter (China Daily)
- This year’s snow melt in Anchorage is one of the earliest on record (Anchorage Daily News)
- In Europe, late spring feels more like winter in May (Al Jazeera)
- Flooding from melting snow overwhelms Midwest (CNN)
- Spring melt and rains spawn floods as Ottawa and Montreal fear a messy weekend (CNN)