Trackers |
 |
GCW and its partners are developing various "trackers" for the cryosphere. Most are based on satellite data. The trackers provide a quick look at the current state of cryosphere relative to the mean state of the last 2-3 decades. Current GCW+partner trackers are described below. Other trackers will be added as they are developed. These and other trackers, some of which were not developed by/for GCW, are also available on the Cryosphere Now pages.
FMI/GCW SWE Tracker
The FMI/GCW SWE Tracker is a product of the Finnish Meteorological Institute (FMI), based on GlobSnow snow water equivalent (SWE). It was developed as part of the GCW Snow Watch project. It illustrates the current Northern Hemisphere snow water equivalent relative to the long-term mean and variability. The current SWE Tracker is shown below. NOTE: The SWE retrievals can be unreliable in summer between approximately late May and early October. Therefore, the plots might not be updated during that period.
EC SCE and SWE Trackers
The Environment Canada (EC) GCW Snow Cover Extent Tracker provides an estimate of the current Northern Hemisphere snow cover extent relative to the 1998-2011 period based on the Canadian Meteorological Centre operational daily snow depth analysis. They are not satellite-derived products. The EC GCW Snow Water Equivalent Tracker provides an estimate of current Northern Hemisphere SWE relative to the 1998-2011 period. It is also based on the Canadian Meteorological Centre operational daily snow depth analysis with SWE estimated using a density look-up table. The CMC analysis uses surface real-time snow depth observations and model-derived information. More information, and trackers for North America and Eurasia, are available at the Canadian Cryospheric Information Network.
GMASI Snow Extent Trackers
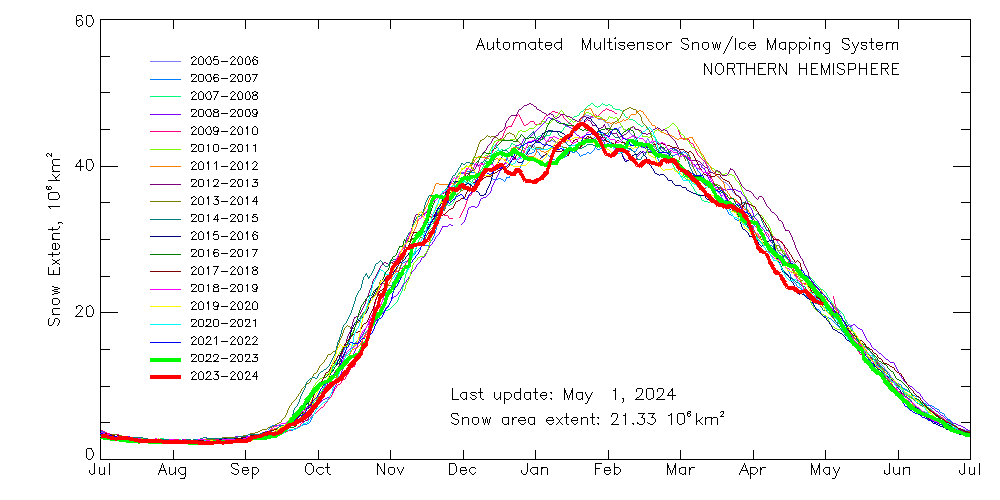
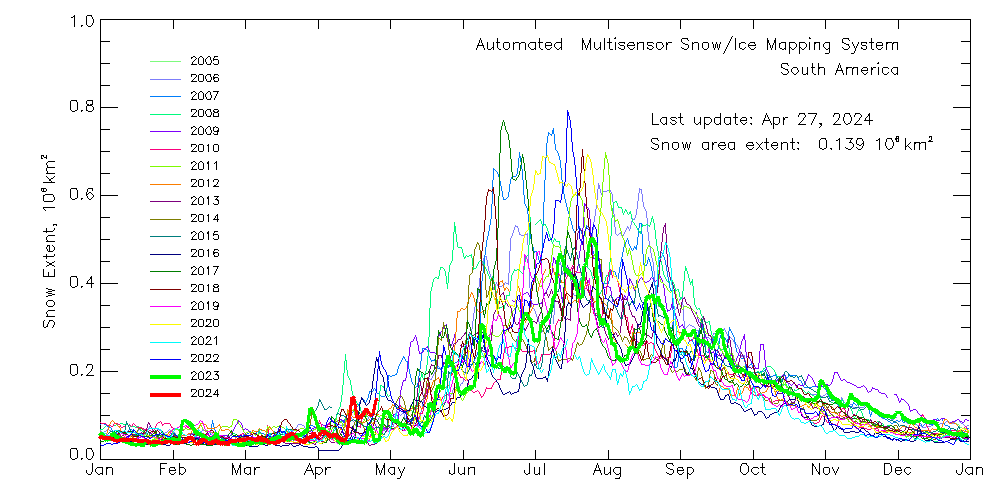
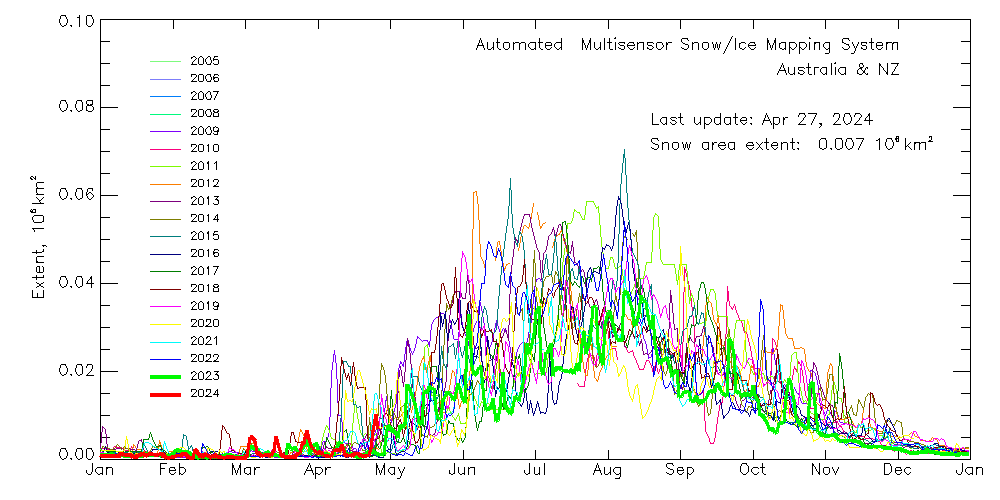
The GMASI Snow Trackers are derived from combined observations of METOP AVHRR, MSG SEVIRI, GOES Imager and DMSP SSMIS. The Global Multisensor Snow/Ice Cover Map (GMASI) algorithm is fully automated. It is a NOAA/NESDIS product. GMASI trackers are currently posted for the Northern Hemisphere, South America, and Australia/New Zealand. Others are available at the link above. (Courtesy of Peter Romanov)
 |
 |
 |
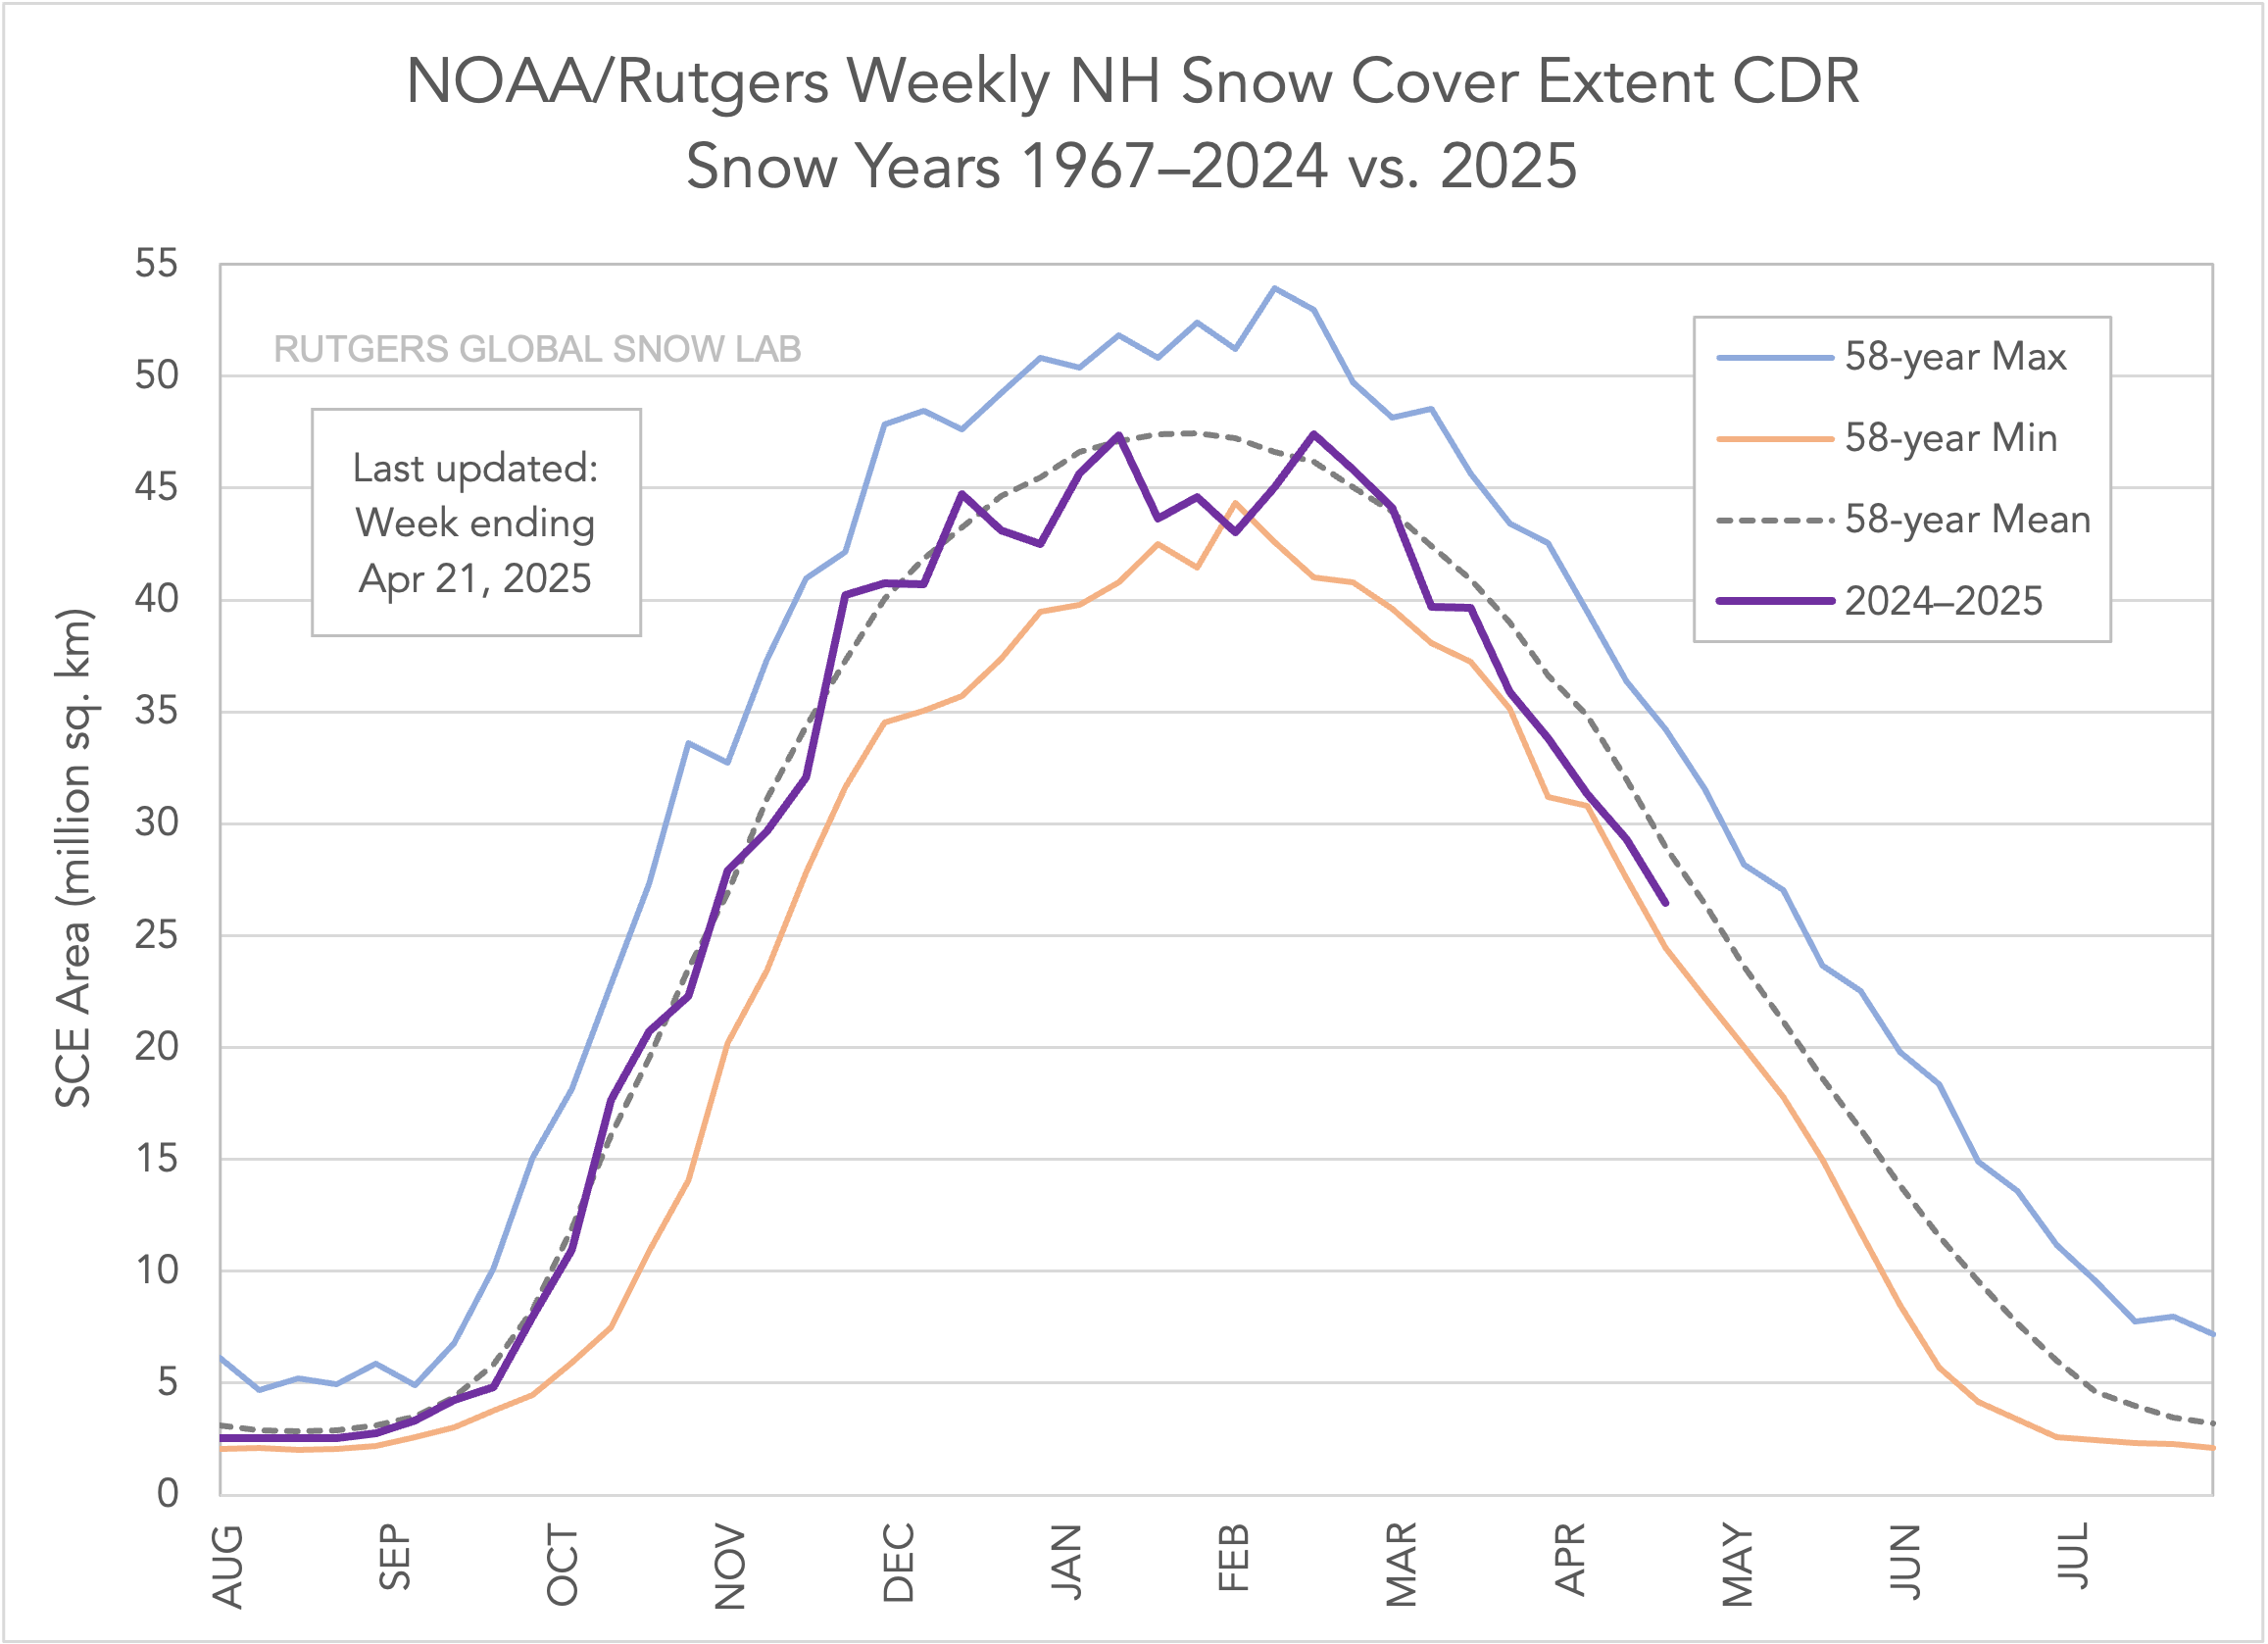
Rutgers Snow Extent Tracke
Snow cover extent (SCE) is calculated at the Rutgers Global Snow Lab (GSL) from daily SCE maps produced by meteorologists at the US National Ice Center, who rely primarily on visible satellite imagery to construct the maps. Maps depicting daily, weekly, and monthly conditions, anomalies, and climatologies may be viewed at the GSL website. The GSL tracker shows weekly NH SCE for the 2023 snow year (purple) plotted with the mean (grey dashed line), maximum (blue), and minimum (orange) SCE for each week. Mean weekly SCE and extremes calculated using the 56-year period from October 1966–July 2022 (excepting September, which is based on 55 years from 1967–2021). Weekly means for the period of record are used for 9 missing months during 1968, 1969, and 1971 to create a continuous time series. Missing months fall between June and October.
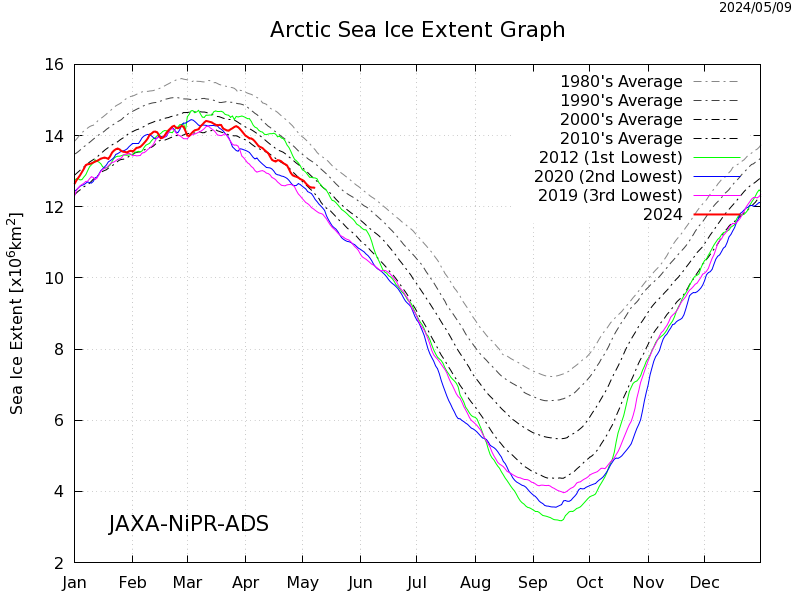
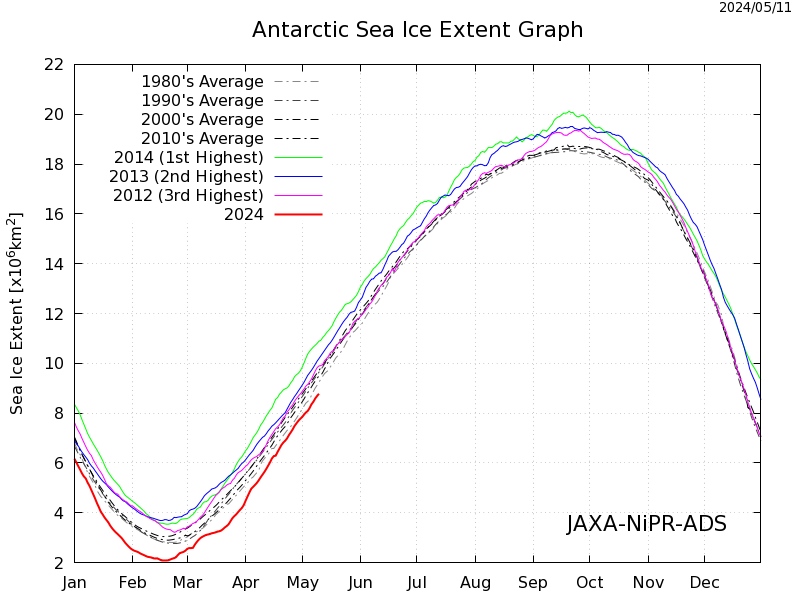
JAXA/NiPR Trackers
The National Institute of Polar Research (NiPR, Japan) and the Japan Aerospace Agency (JAXA) have developed sea ice extent trackers based on AMSR2 data. Additional information and nn interactive version of their products are available on their website.
 |
 |