Cryosphere Now: Ice Sheets
The most recent ice sheet information is given below. Hover over a thumbnail to get the full image, description, and credits. Important: The products shown on the "Cryosphere Now" pages provide a variety of perspectives on the state of the cryosphere. They are for purposes of illustration and comparison and are not necessarily endorsed by GCW as "authoritative".
Northern Hemisphere:
Greenland Melt Days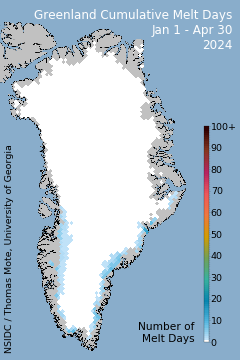 Greenland Melt Days is from NSIDC, based on melt data from Thomas Mote at University of Georgia, who uses SSMIS from NSIDC. |
Greenland Mass Balance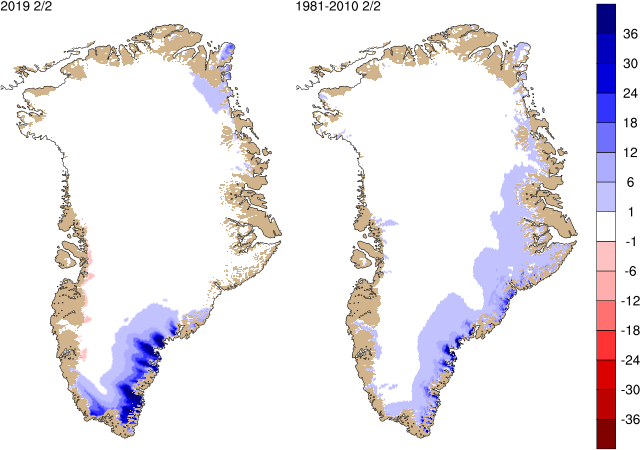 The Danish Meteorological Institute's Greenland mass balance plots (http://beta.dmi.dk/groenland/maalinger/indlandsisens-massebalance/) provide model predictions of mass balance from one of DMI's climate models forced with snowfall, evaporation, solar radiation and other fields generated by a research weather model for Greenland, Hirlam-Newsnow. The spatial distribution maps show the mass balance for the day specified at the top (left panel, in mm water equivalent per day) and the average mass balance for this calendar day over the period 1990-2011 (right panel). |
Greenland Mass Balance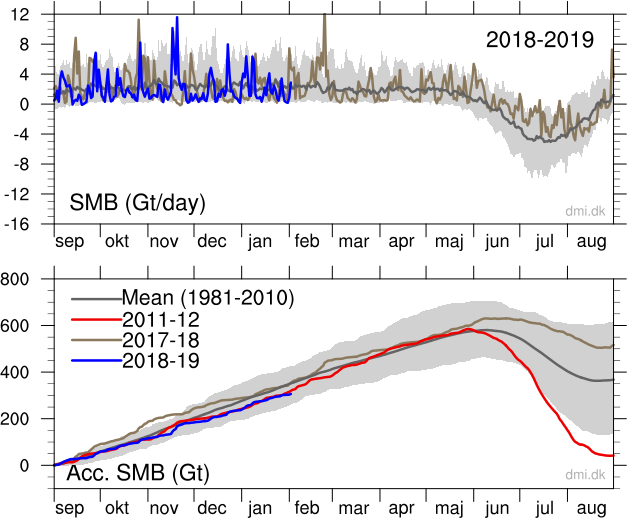 The Danish Meteorological Institute's Greenland mass balance plots (http://beta.dmi.dk/groenland/maalinger/indlandsisens-massebalance/) provide model predictions of mass balance from one of DMI's climate models forced with snowfall, evaporation, solar radiation and other fields generated by a research weather model for Greenland, Hirlam-Newsnow. The time series plots show the total daily contribution to the mass balance of the Greenland (top, blue line, Gt/day), and the cumulative mass balance from 1 September to now (bottom, blue line, Gt). The dark gray line shows the corresponding average value from climatology with two standard deviations on each side (light gray). At the bottom it also displays the season 2011-12 (red), which had particularly high melting on Greenland. |
Southern Hemisphere:
AARI/NIC/NMI Tabular Icebergs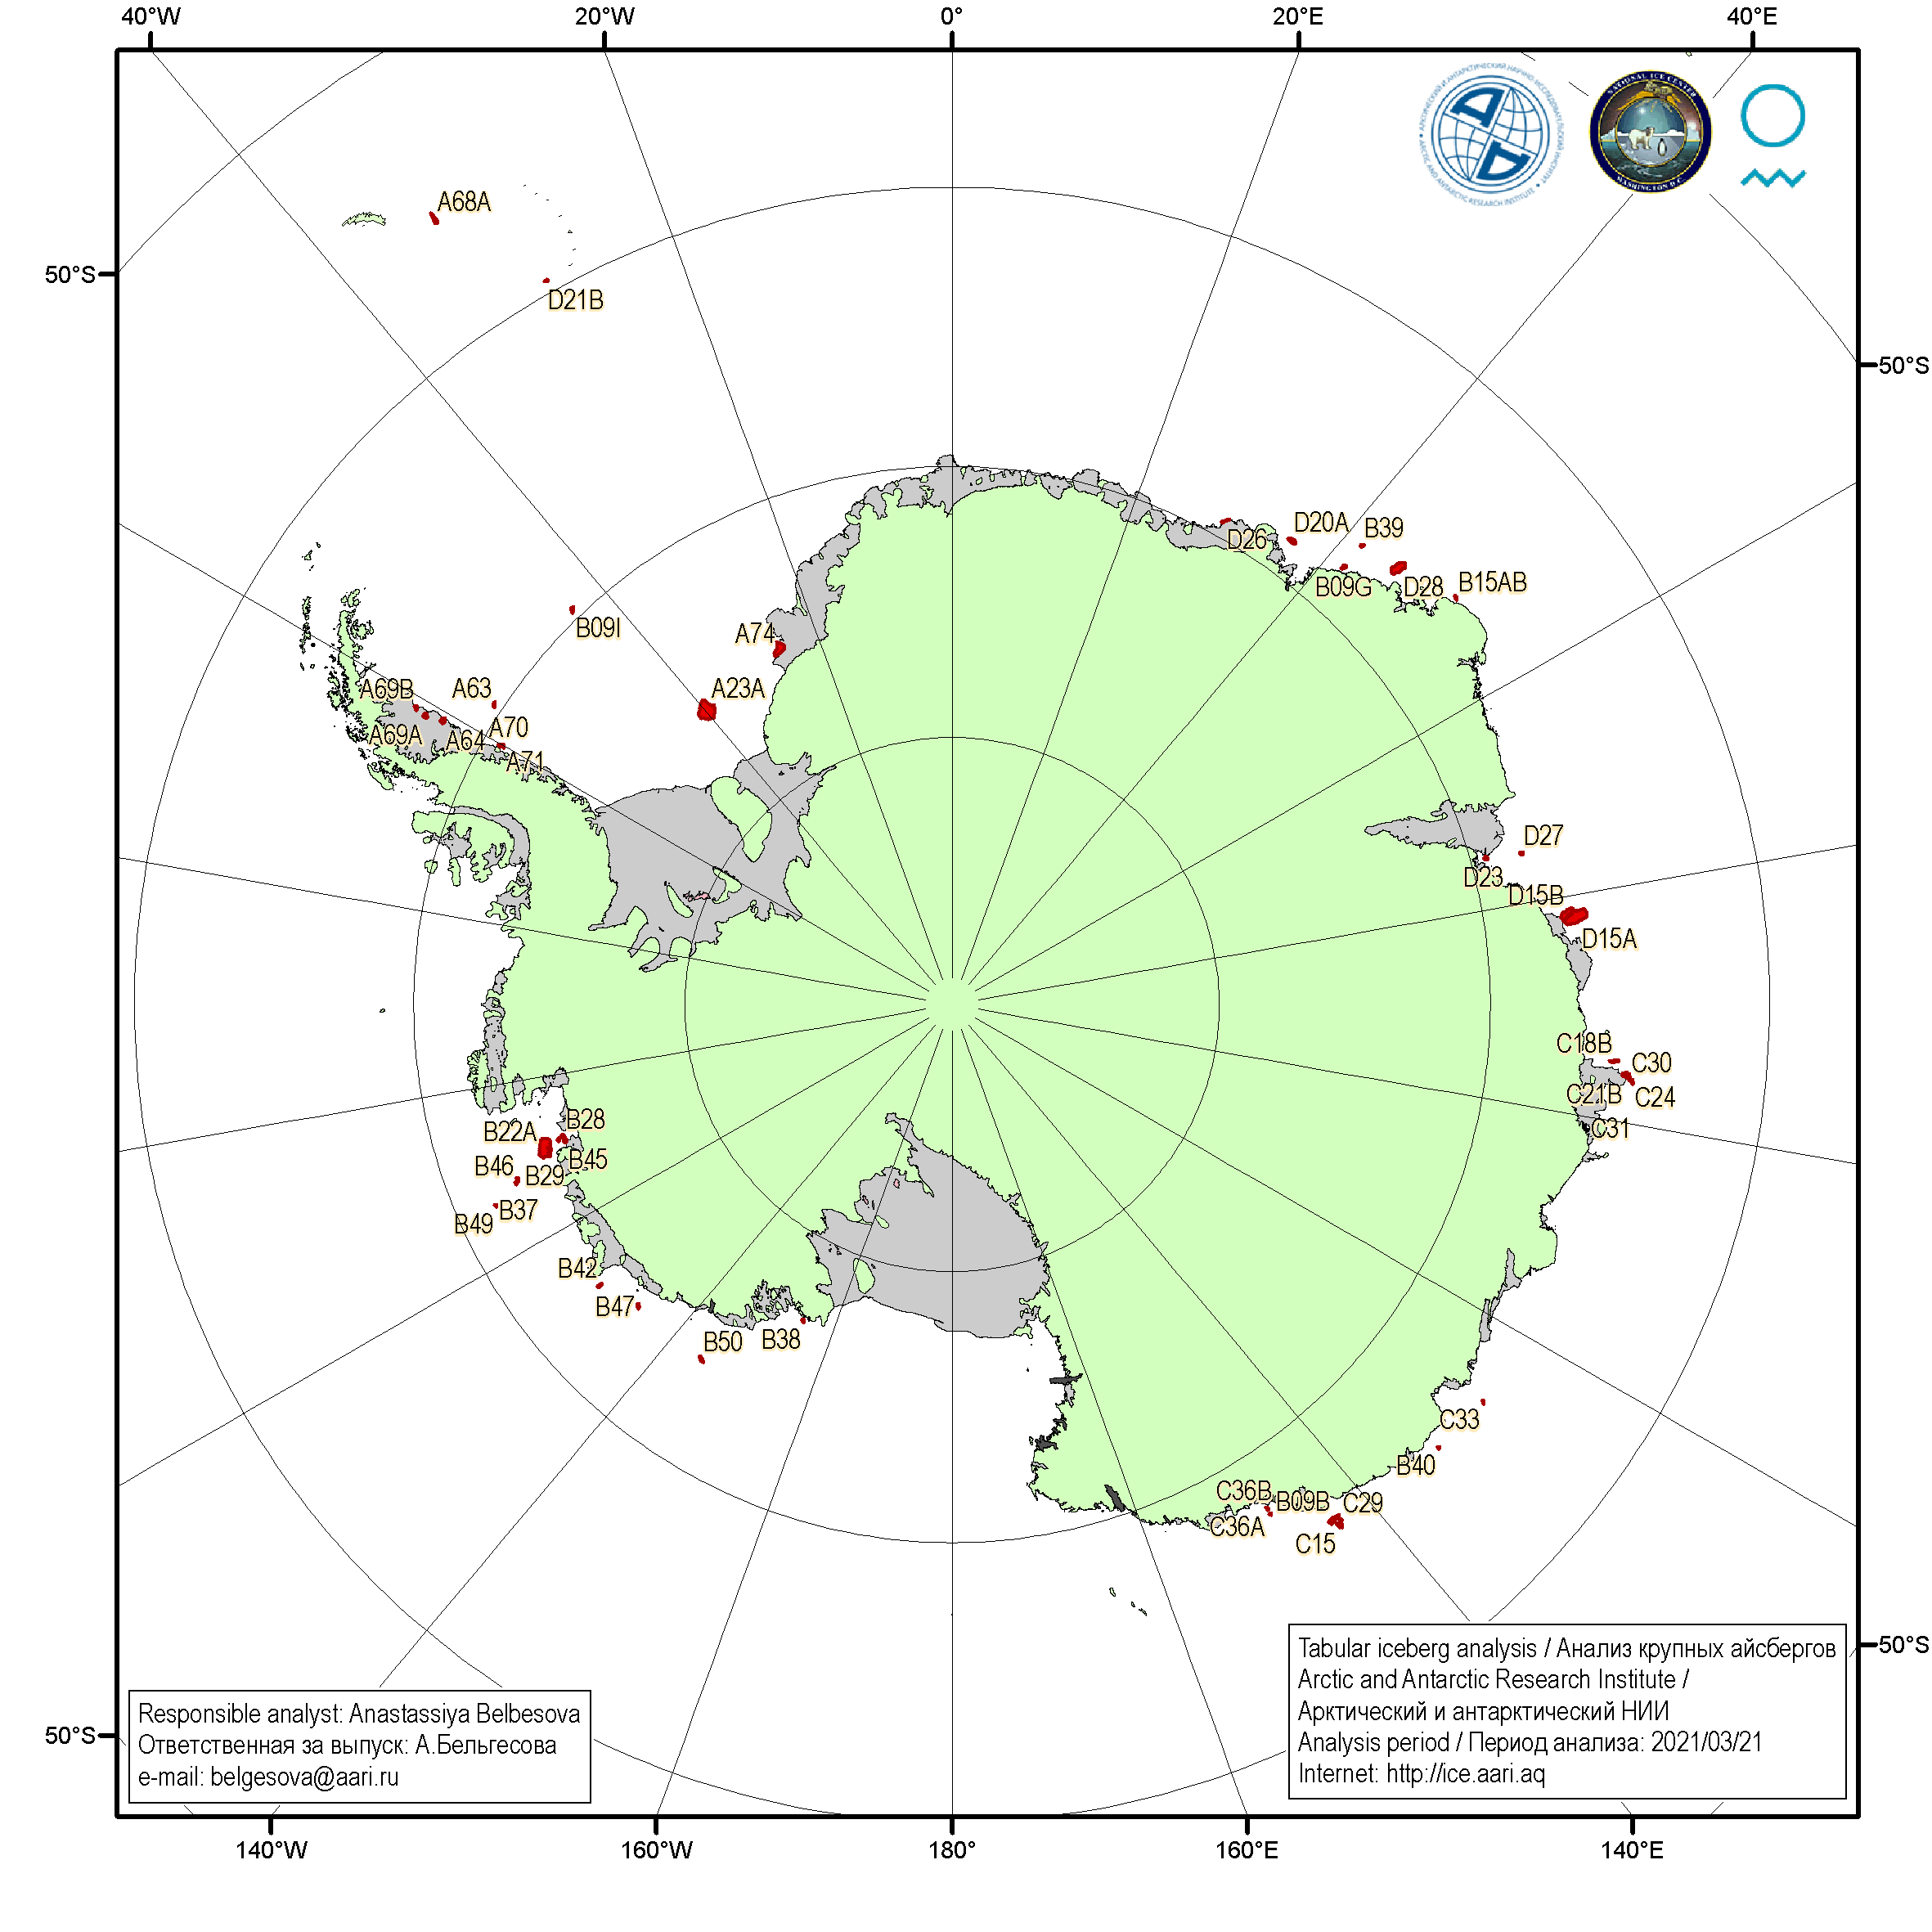 Tabular icebergs analysis (shape and position) from the AARI/NIC/NMI pilot project on integrated sea ice analysis for Antarctic water (Arctic and Antarctic Research Institute, Russian Federation/National Ice Center, USA/Norwegian Meteorological Institute) (full resolution graphic at http://ice.aari.aq/latest/gcw_portal/antbrg_latest.png; vector SIGRID-3 at http://ice.aari.aq/latest/gcw_portal/antbrg_latest.zip). |
APP-x Temperature Tracker The current (4-day old) surface (skin) temperature compared to the recent climatology (mean plus/minus one standard deviation) from the AVHRR Polar Pathfinder-Extended (APP-x) product. Area coverage is 65-90oS, which includes both sea ice and the ice sheet. This is an experimental product. |
APP-x IST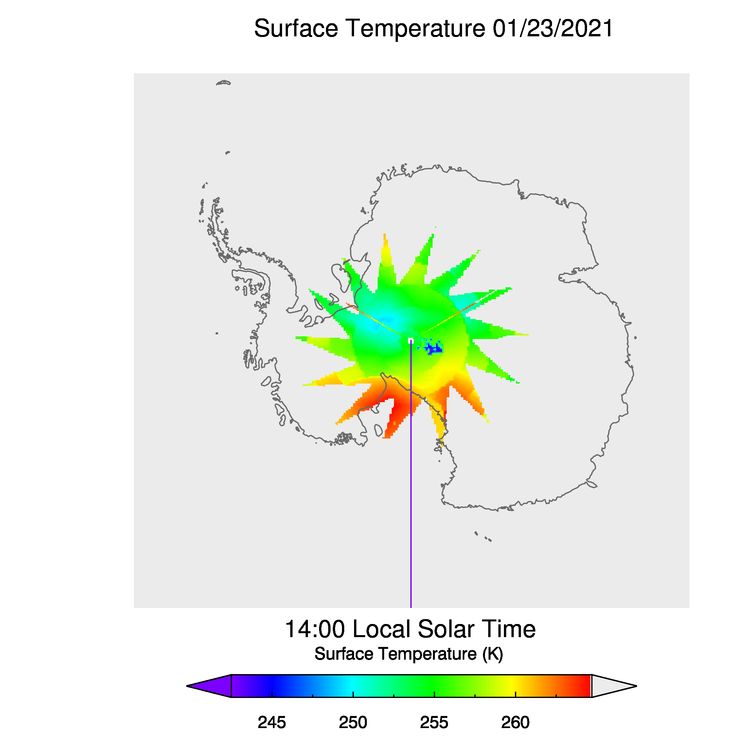 APP-x is the extended AVHRR Polar Pathfinder. It is a 30+ year product suite of twice-daily composites for the Arctic and Antarctic, updated daily (though a few days old). It is a research product and some parameters are experimental. |
APP-x Albedo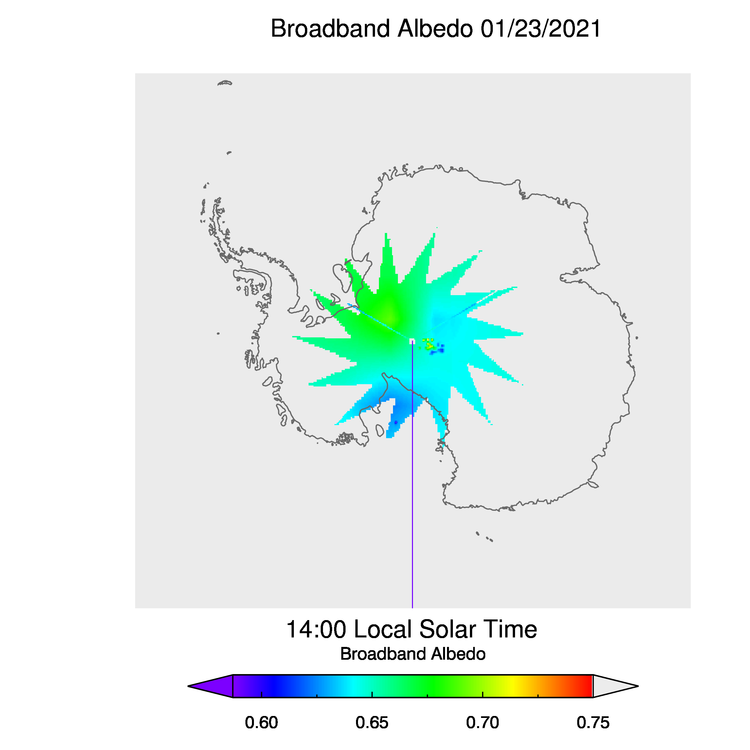 APP-x is the extended AVHRR Polar Pathfinder. It is a 30+ year product suite of twice-daily composites for the Arctic and Antarctic, updated daily (though a few days old). It is a research product and some parameters are experimental. |
Other Resources:
- Cryo-TEMPO, an ESA project
- Gravimetric mass balance of the Antarctic Ice Sheet, an ESA CCI Project
- Gravimetric mass balance of the Greenland Ice Sheet
- Ice Flow and Calving - Timeseries
