Cryosphere Now: Permafrost and Seasonally Frozen Ground
The most recent frozen ground information is given below. Hover over a thumbnail to get the full image, description, and credits. Note, however, that permfrost changes slowly, so the information provided here may only be updated annually or semi-annually. Important: The products shown on the "Cryosphere Now" pages provide a variety of perspectives on the state of the cryosphere. They are for purposes of illustration and comparison and are not necessarily endorsed by GCW as "authoritative".
Northern Hemisphere:
Alaska Permafrost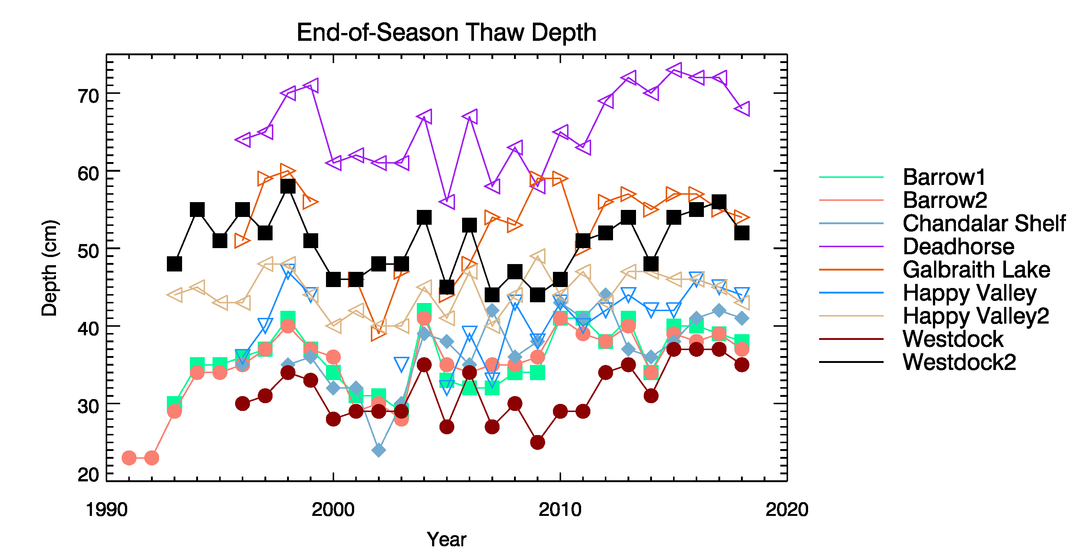 Time series of thaw depths measured in Alaska’s North Slope and Brooks Range regions. Data are from the Circumpolar Active Layer Monitoring (CALM) website. |
Northern Hemisphere ALT Trends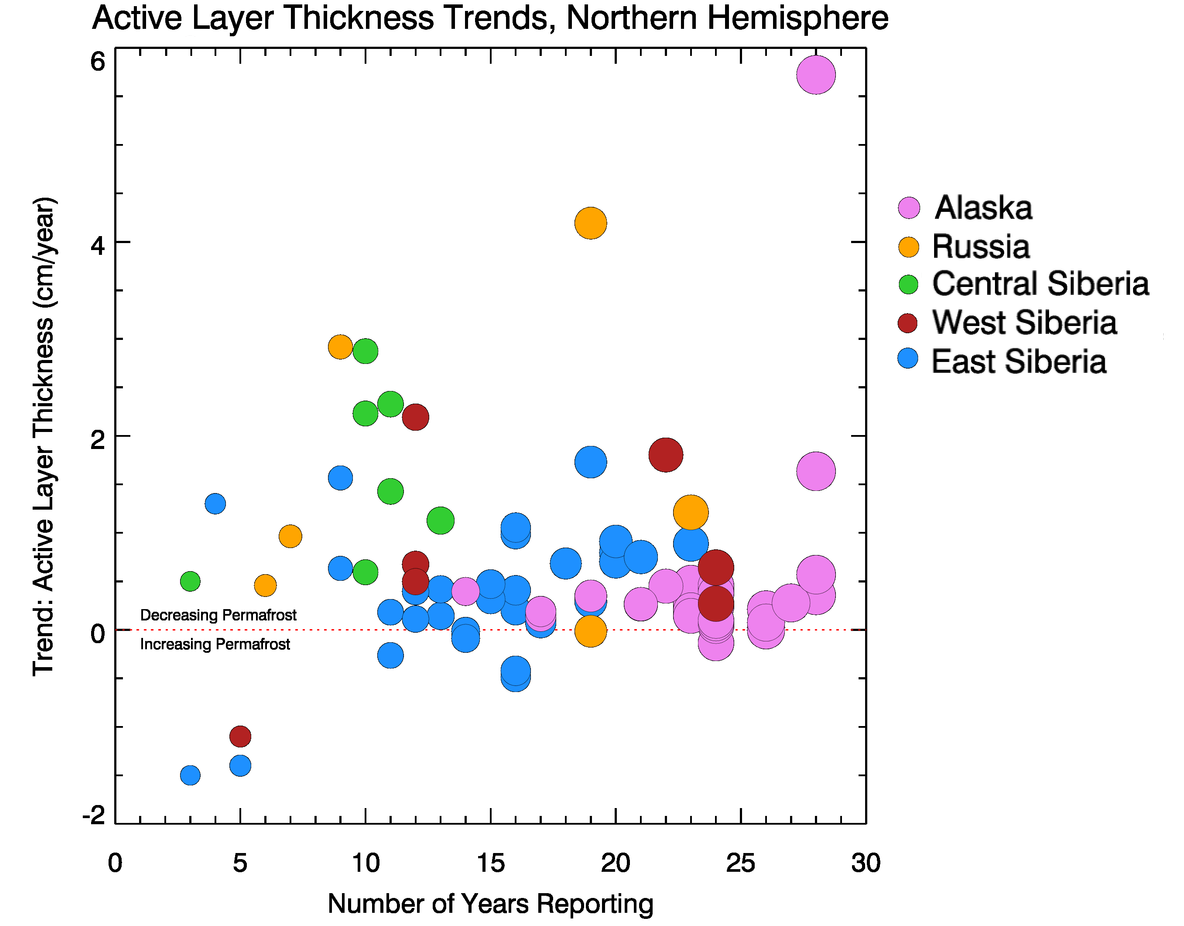 Scatterplot of active layer thickness trends versus number of years reporting over all 2018 Northern Hemisphere sites current in 2018. Relative circle size also relates the number of years reporting at the site. Data are from the Circumpolar Active Layer Monitoring (CALM) website. |
Southern Hemisphere:
Antarctica ALT Trends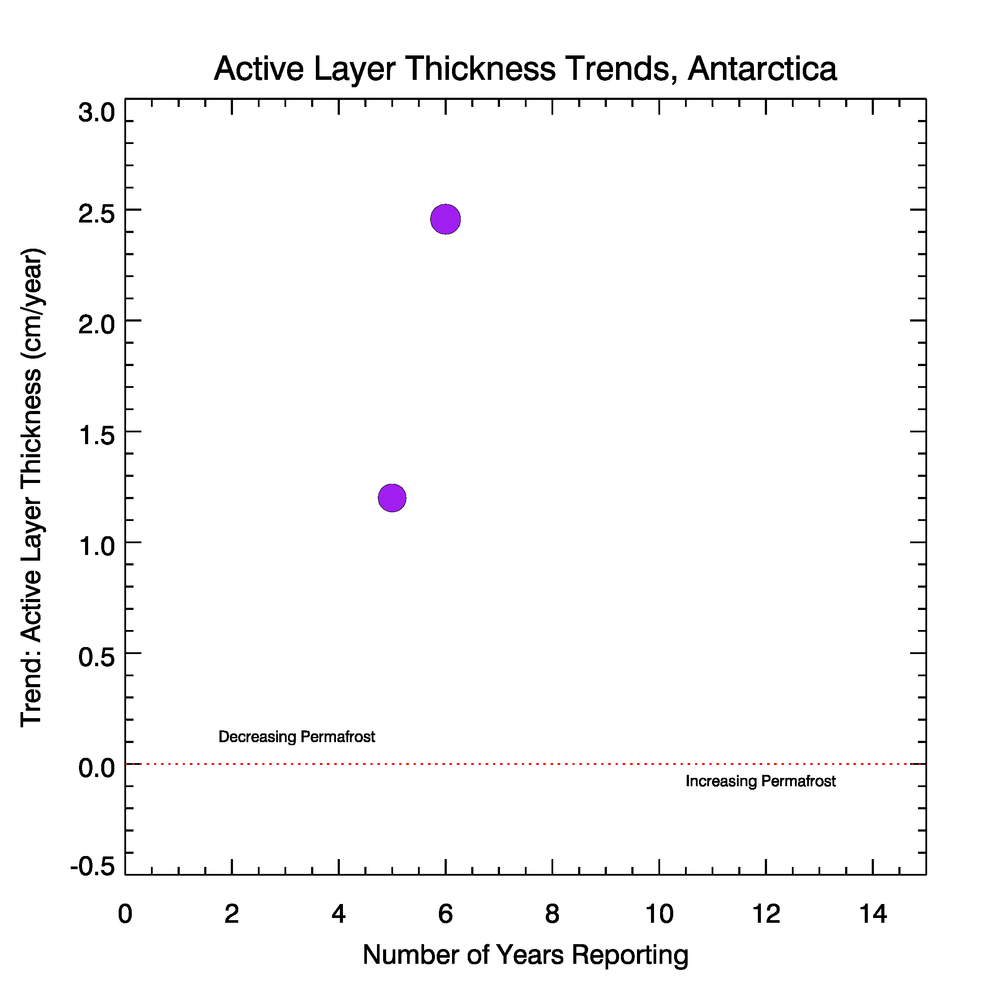 Scatterplot of active layer thickness trends versus number of years reporting over Antarctica. Both sites most recent measurement is from 2017. Currently, data is available for only two locations for the last 6 years as a result of the work by Hrbáček et al., 2017. |