Glacier and Ice Cap Assessments |
 |
2018 Glacier Assessment
Aaron Letterly
27 June 2019
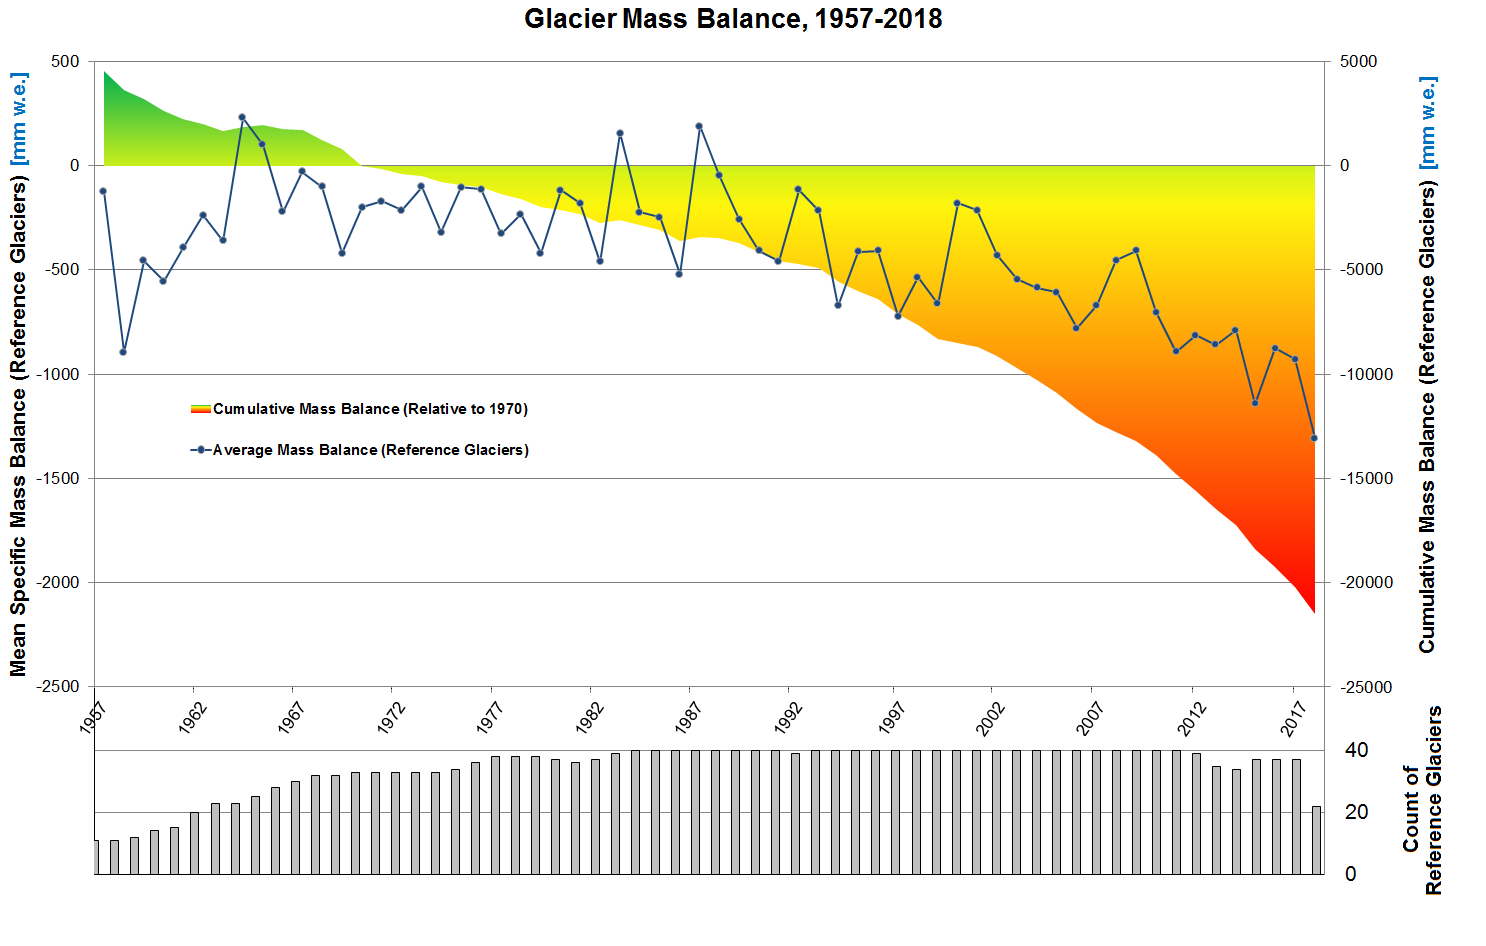
The narrative remains the same for worldwide glacial mass balance: large decreases in mass throughout the 2016/2017 season and continuing into the 2017/2018 season. Glacial mass balance decreased overall for the 40th consecutive year according to preliminary reports by the World Glacier Monitoring Service (WGMS). This corresponds with 2018 being the 42nd consecutive year (since 1977) that global surface temperatures were above the 20th century average. Figure 1 shows that the cumulative mass balance of all 40 reference glaciers dipped below 21,000 millimeters of liquid water equivalent (mm w.e.) lost compared to the 1970 totals. This mass decrease would correspond to a reduction in over 21 vertical meters of water spread out over the entire reference glacier area. At the time of this writing, only the Russian glacier Djankuat had a positive mass balance out of the 25 international reference glaciers reporting. The average mass balance change for the reference glaciers in 2017/2018 was -1308 mm w.e., the lowest since 1957.

Figure 1: Glacial mass balance (in mm w.e.) for all reference glaciers, worldwide. The shaded region on either side of the zero line is the cumulative mass balance for reference glaciers relative to 1970, while the gray bars represent the number of reporting reference glaciers for that year (bottom right axis). The blue line shows the average reference glacier mass balance for each year. Data is from the World Glacier Monitoring Service. (Click to enlarge)
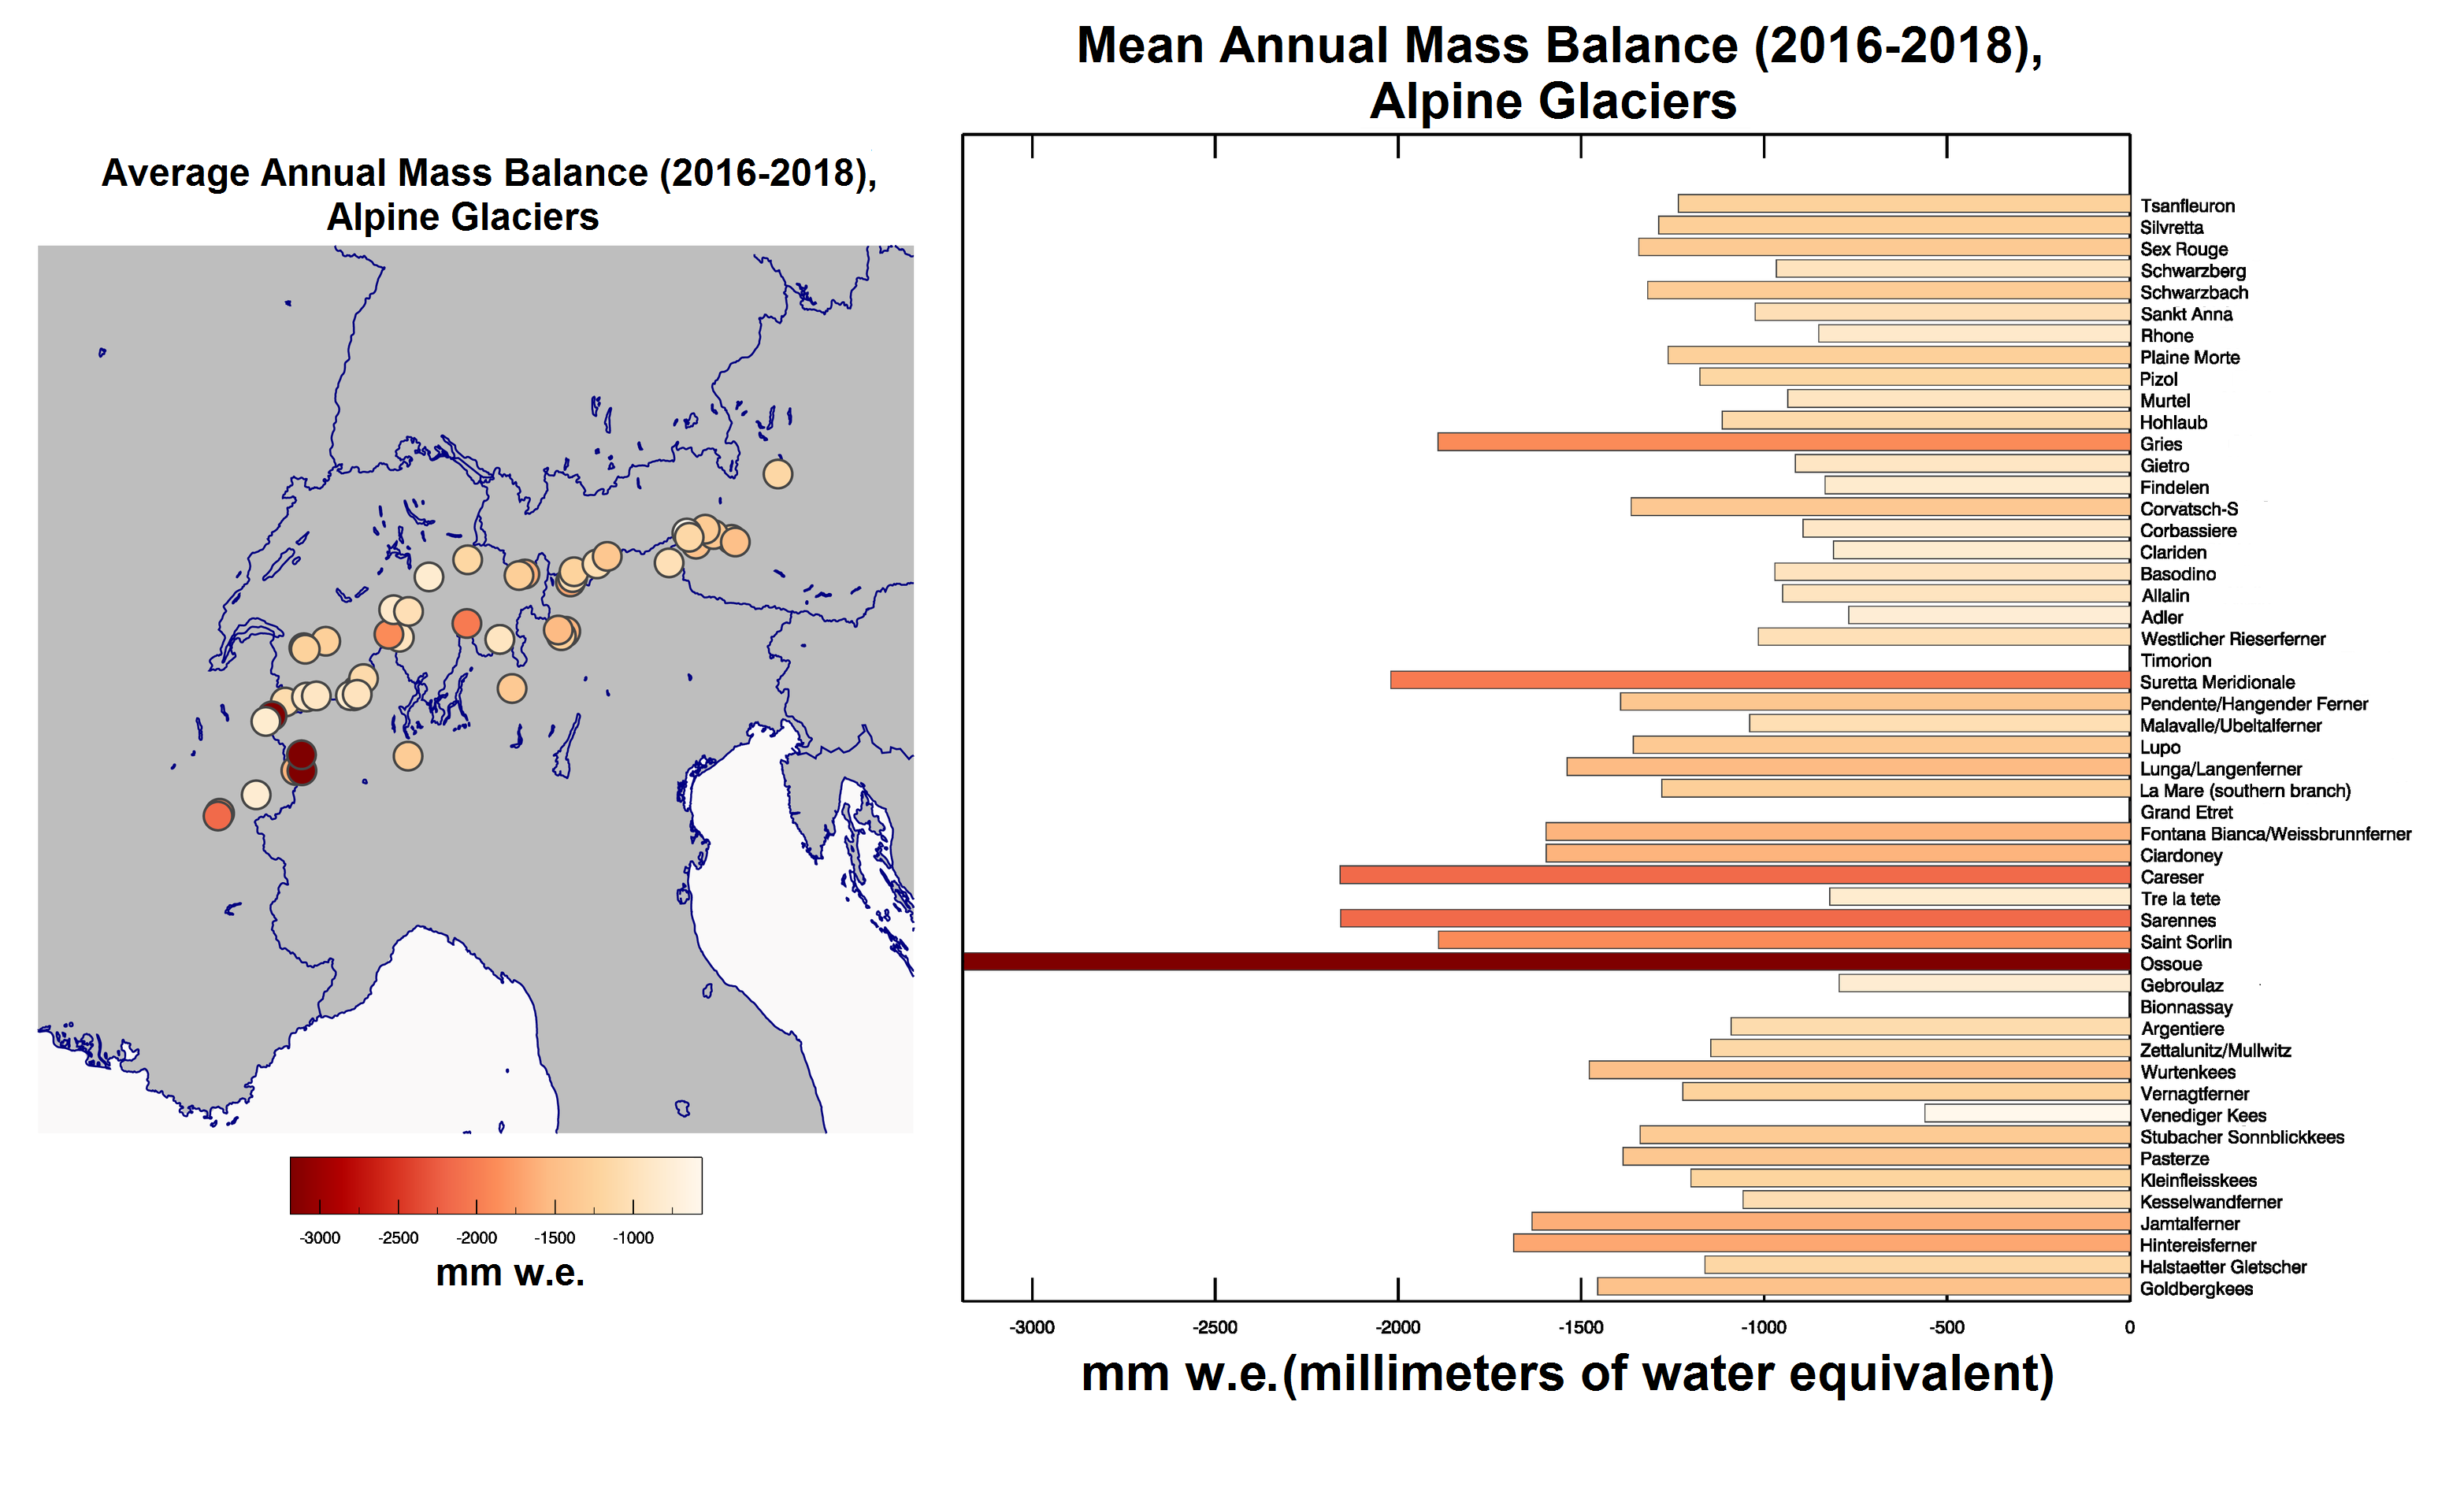
Figure 2 shows average glacial mass balances for the last three hydrological years (2015/2016, 2016/2017, 2017/2018) over a region of the Alps encompassing France, Switzerland, Italy, and Austria. Mass balances of selected reference and non-reference glaciers in the region are shown. Filled circles show the glacier’s location on the left. The bar plot on the right shows the glacier’s recent average annual mass balance by name. Though not shown on the map, the Ossoue glacier (French Pyrenees) lost an outstanding 5000 mm w.e. in 2016/2017 alone. The mean mass balance between 2016 and 2018 over all European, non-Scandinavian glaciers was -1295 mm w.e.

Figure 2: Average glacial mass balance (in mm w.e.) for selected glaciers in the Alps from 2016-2018 (left). Bar plot showing annual mass balance for named glaciers (right). Data is from the World Glacier Monitoring Service. (Click to enlarge)
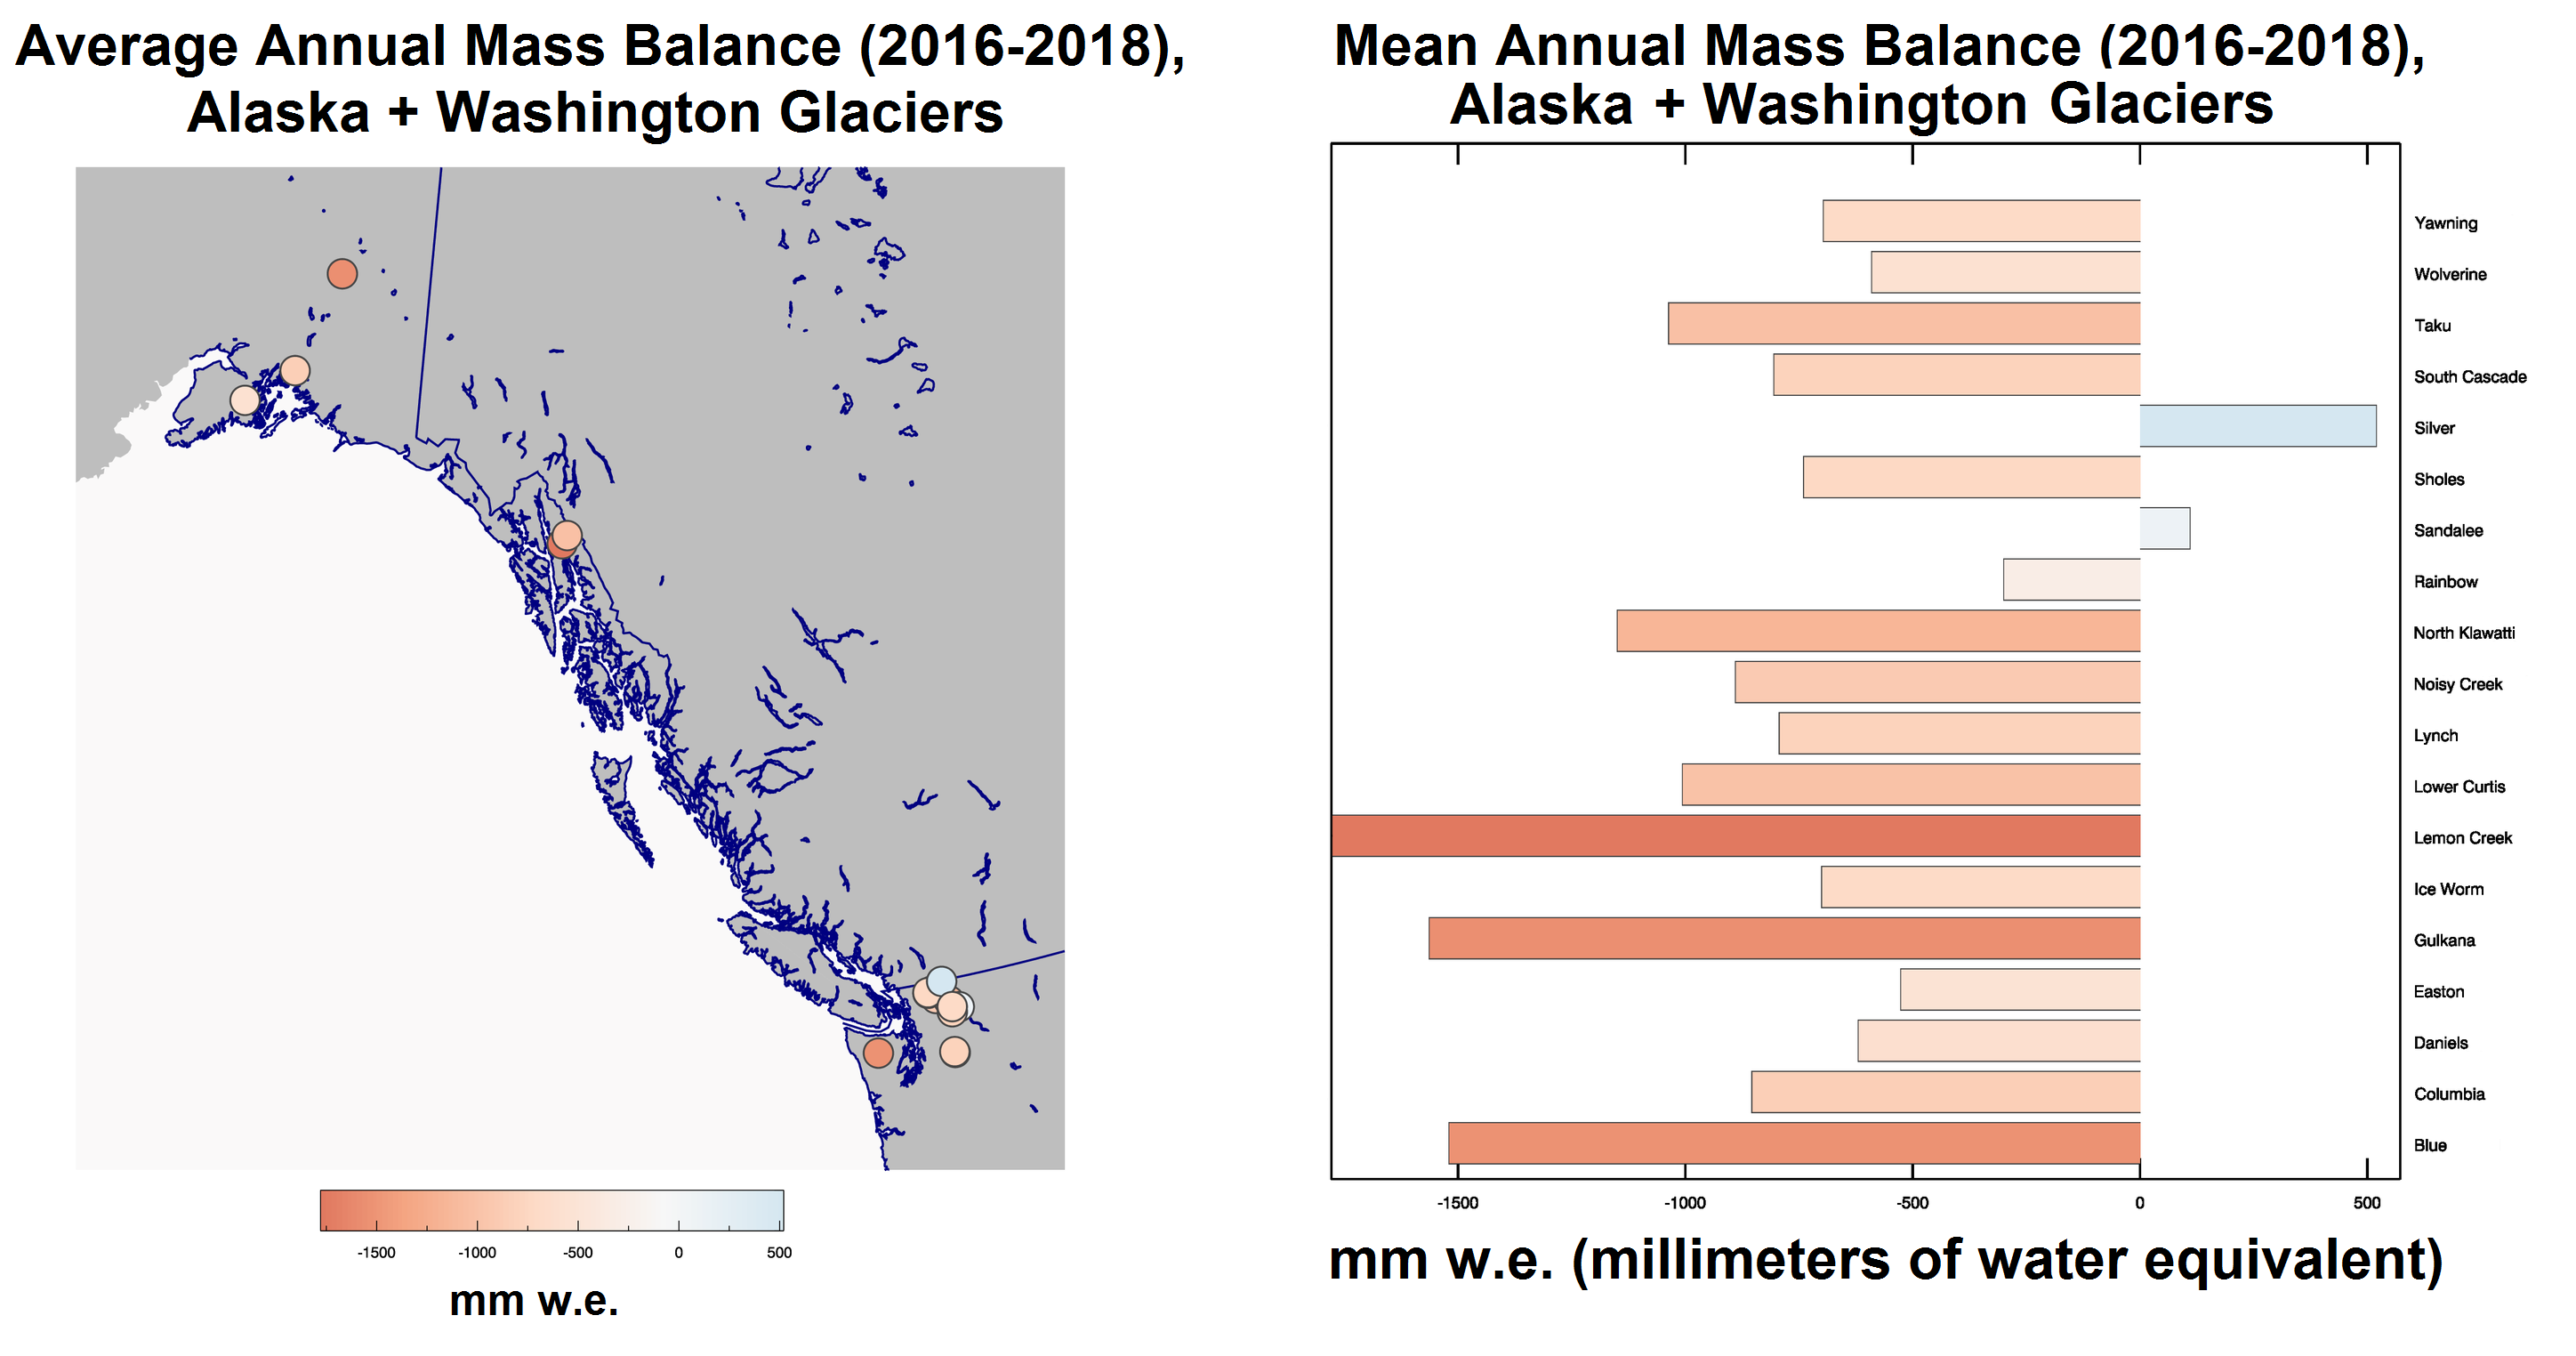
In North America, the coastal mountain ranges stretching from Washington to Alaska in the Pacific Northwest hold many well-studied glaciers. Their mass balances from 2016-2018 can be seen in Figure 2. The Silver and Sandalee glaciers (Washington, USA) reported positive mass balances over the time period, though the majority of the rest of the large glaciers in this region reported average mass balance losses of between 500 and 1500 mm w.e. A 2018 study determined that recent changes in atmospheric circulation over the Pacific Northwest reduced glacial mass decreases due to seasonally increased snowfall, at least between 2000-2009 (Menounos et al., 2018). The mean mass balance between 2016 and 2018 over all Pacific Northwestern Glaciers in the USA was -786 mm w.e.

Figure 3: Average glacial mass balance (in mm w.e.) for selected glaciers in the Pacific Northwest from 2016-2018 (left). Bar plot showing annual mass balance for named glaciers (right). Data is from the World Glacier Monitoring Service.
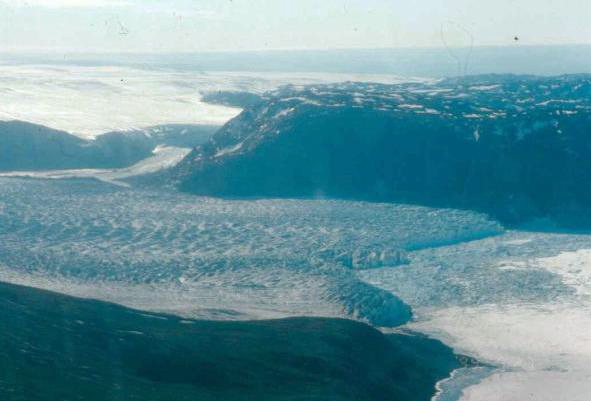
In Antarctica and Greenland, coastal ice is lost every year when it is discharged from glacial tongues into the ocean. The ice and meltwater runoff from these glaciers drains out to sea, resulting in coastal glaciers receding further inland and decreasing in ice volume and thickness. The loss of mass in these regions is quantified by mass concentration anomalies from satellite. Unfortunately, the National Aeronautics and Space Administration’s Gravity Recovery and Climate Experiment (NASA GRACE) mission ceased scientific operations after June 2017. New data from the GRACE Follow-On mission should be available in the late summer of 2019. At the last update, both the Antarctic and Greenland ice sheet had been experiencing an increase in ice loss year-after-year since 2009 and were near all-time lows in ice sheet mass.
References
Menounos, B., R. Hugonnet, D. Shean, A. Gardner, I. Howat, E. Berthier, B. Pelto, C. Tennant, J. Shea, M. J. Noh, F. Brun, and A. Dehecq (2018), Heterogeneous Changes in Western North American Glaciers Linked to Decadal Variability in Zonal Wind Strength, Geophys. Res. Lett., 46, doi: https://doi.org/10.1029/2018GL080942.
NOAA National Centers for Environmental Information, State of the Climate: Global Climate Report for Annual 2018, published online January 2019, retrieved on June 27, 2019 from https://www.ncdc.noaa.gov/sotc/global/201813.
Watkins, M. M., D. N. Wiese, D.-N. Yuan, C. Boening, and F. W. Landerer (2015), Improved methods for observing Earth's time variable mass distribution with GRACE using spherical cap mascons, J. Geophys. Res. Solid Earth, 120, doi:10.1002/2014JB011547.
D.N. Wiese. 2015. GRACE monthly global water mass grids NETCDF RELEASE 5.0. Ver. 5.0. PO.DAAC, CA, USA Wiese, D. N., F. W. Landerer, and M. M. Watkins (2016), Quantifying and reducing leakage errors in the JPL RL05M GRACE mascon solution, Water Resour. Res., 52, 7490-7502, doi:10.1002/2016WR019344.
WGMS (2008): Global Glacier Changes: facts and figures. UNEP/UNESCO/WMO, World Glacier Monitoring Service, Zurich: 73 pp.


