Changes in the Cryosphere Over Time |
 |
Trends Through 2019
Aaron Letterly
12 May 2020
The cryosphere is a complex part of the climate system that experiences change on different timescales. Data collected over many years helps to distinguish long-term trends from short-term variability. The "stacked plots" below track changes for key cryospheric and cryosphere-related variables. Brief summaries of recent changes are given. The purpose is to provide a quick look at changes in the cryosphere overall. More detailed assessments of the individual cryosphere components are available through the "Other Assessments" box on the right. The information here will be updated at least once each year.
Northern Hemisphere
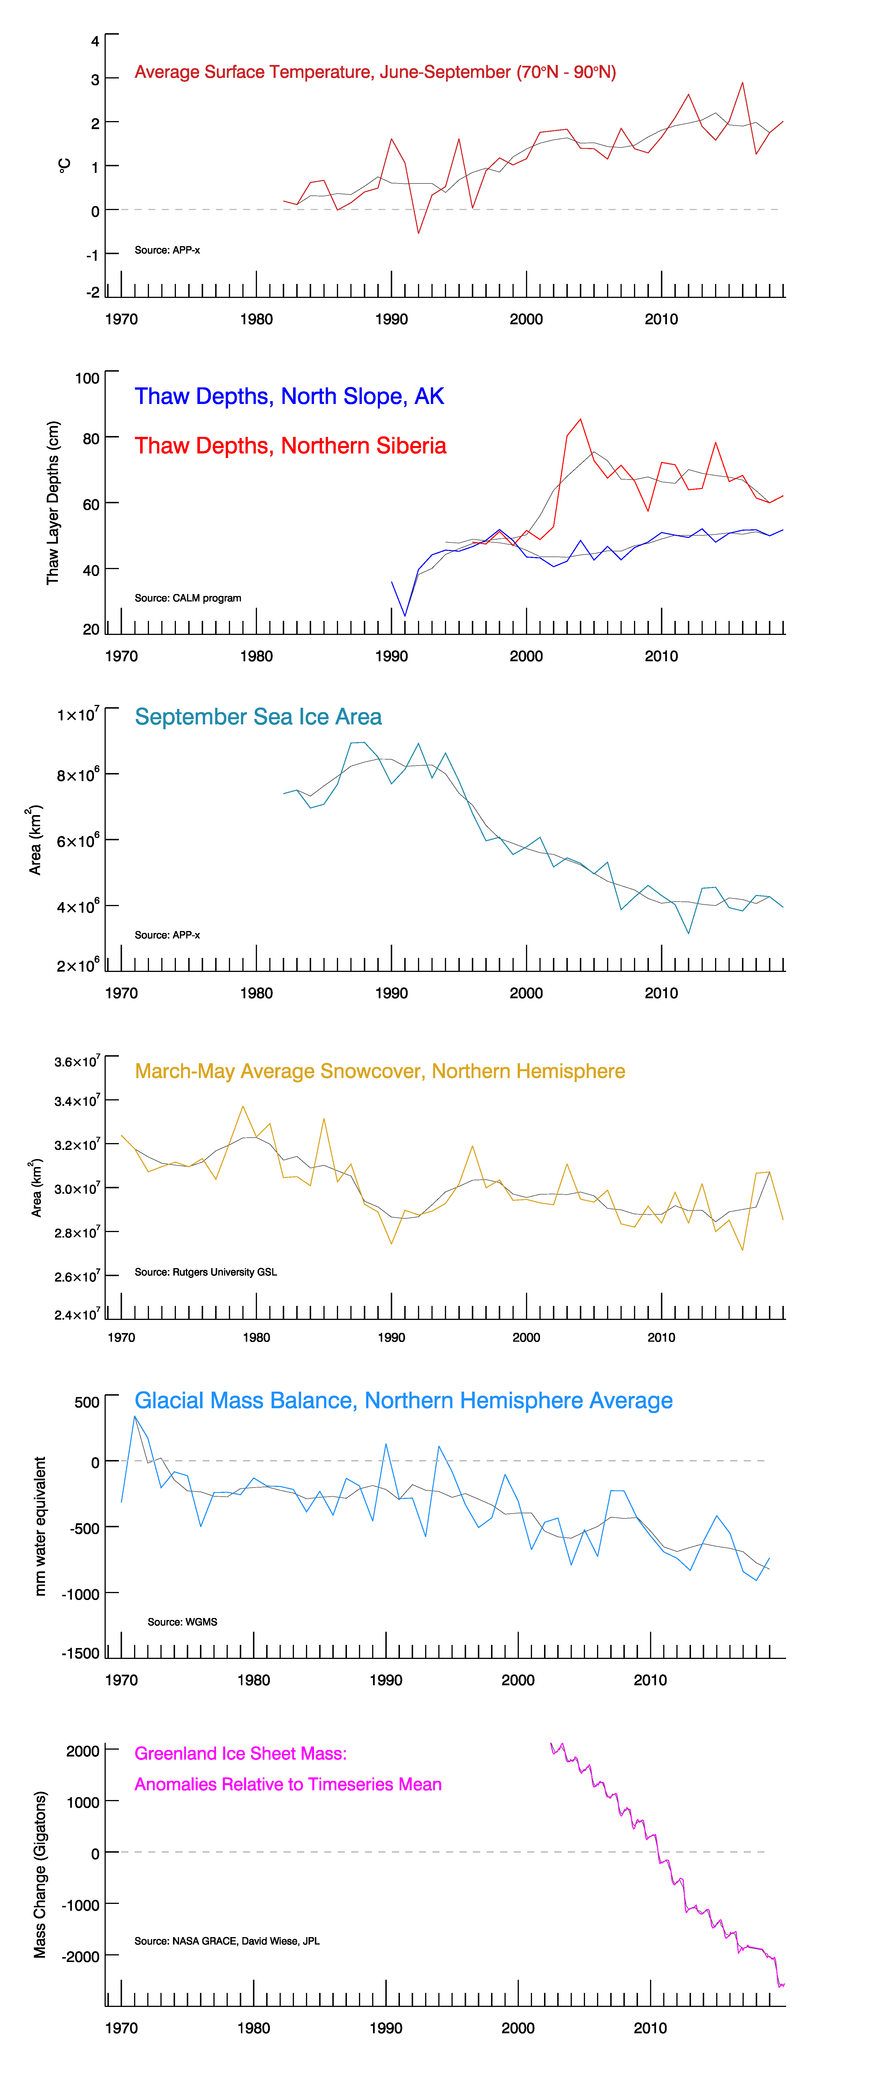
There have been significant changes in the Arctic climate system since 1970. At current rates, these changes may radically alter the radiative and ecological properties of the Arctic within our lifetime. Surface temperature, permafrost depth, sea ice area, snow cover, and glacial mass balance are all decisive indicators of change. Figure 1 provides time series of these variables for the Northern Hemisphere (NH) or Arctic from the beginning of their records or from 1970.
|
Surface Temperature - Satellite data has provided a continuous record of Arctic temperatures since 1982. For Arctic summer temperature trends, mean monthly temperatures are averaged over June-September. Above 70°N, summer temperatures have been steadily increasing since the beginning of the data record. The mean summer temperature in 2019 was 2.01°C, the fourth-highest mean summer temperature on record and within 1°C of the 2016 maximum (2.9°C). Permafrost Thaw Depths - A network of in-situ measurement sites in Alaska and Siberia monitor the changes in the active layer1 as far back as 1990. Over the last 30 years, the active layer has thawed more deeply in response to increasing surface temperatures. Thaw depths in northern Alaska during 2019 measured 51.74 cm, on average. The average active layer depth over norther Siberia was 62.06 cm. Active layer thickness in both regions increased compared to last year, which may be due to 2019 being the second warmest year on record over land and ocean (NOAA Global Climate Report). Average thaw depths in both regions have increased more than 10 cm since the beginning of their data records. September Sea Ice Area - Passive microwave data from satellites has observed the dramatic decrease in sea ice continuously since 1982. Higher temperatures and the increased absorption of solar radiation due to the ice-albedo feedback have been responsible for drastic decreases in September sea ice area and extent in the last 20 years. In 2019, ice concentration data from APP-x totaled approximately 3.95 million square kilometers of sea ice area, which is 320,000 square kilometers fewer than last year (an area of loss larger than the size of Italy). Only four years had lower average September sea ice area, all within the last twelve years. Spring Snow Cover - Spring snow cover, averaged from March through May in the Northern Hemisphere, has generally decreased in area and duration since measurements were first available in the late 1960s. In 2019, spring snow cover in the Northern Hemisphere averaged 28.5 million square kilometers, which was a precipitous drop from the 2018 average. 2019 was the 9th lowest spring snow area on record. Glacial Mass Balance - Changes in Earth’s glaciers have been catalogued systematically since 1957 by the World Glacier Monitoring Service (WGMS). Over the last 45 years, glacial records show that the bodies of ice have been decreasing in size and number. Mass lost from a glacier as meltwater is measured in vertical thickness lost from the height of the glacier. In 2018, glaciers worldwide lost mass, on average, equal to 891 mm of water, and this trend of increasing mass loss continued into 2019, when the average loss was 1,131 mm of water. The average mass balance of reference glaciers worldwide has been negative in 39 of the last 40 years. Greenland Ice Sheet Mass - Over the last 18 years, the losses in mass at the edges of the Greenland Ice Sheet have outpaced the accumulation of ice at its center, resulting in immense losses in its total mass. Since 2002, NASA’s Gravity Recovery and Climate Experiment (GRACE) satellites have been able to measure the local gravity changes near the Greenland Ice Sheet, determining an approximate amount of ice lost each year in GT (gigatons; 1 GT = 1012 kilograms). By May of 2020, the Greenland Ice Sheet has lost 4,708 GT since measurements began in 2002. This is 2,561 GT below the average mass of the 2002-2017 mean. |
Fig. 1. Changes in the NH or Arctic from 1970-2019, except where noted. From the top down: Arctic surface temperature, permafrost thaw depth in Alaska and northern Siberia, September Arctic sea ice area, March-May NH snow cover, NH glacial mass balance, and Greenland ice sheet mass anomalies. Grey lines are the 5-year running mean except for Greenland ice mass, which shows the annual averages. See below for data sources. Hover the cursor over any of the plots for a larger version. Click on the plot for a full-size version of the stacked plot in a new browser tab.
Southern Hemisphere
The Southern Hemisphere (SH) is dominated by oceans and has far less land surface area than the Northern Hemisphere. The Antarctic continent, though surrounded by ice and covered in snow, is large and remote enough that data records of changes in its ice sheet are not comprehensive. Satellite-derived snow cover products have relatively large uncertainties in part because much of the SH snow cover outside of Antarctica occurs in alpine areas, which creates challenges for remote sensing. Surface temperature, sea ice area, glacial mass balance, and Antarctic Ice Sheet mass balance are decisive indicators of change to Southern Hemisphere’s climate system. Recent changes in these variables are shown below.
|
|
Surface Temperature - For Antarctic summer temperature trends, satellite-derived mean monthly temperatures for land and ocean are averaged over December-March. Below 65°S, summer temperatures prior to the early 2000s were highly variable. The mean summer temperature in 2019 increased substantially from 2018 to its highest over the APP-x data record, reaching of -6.2°C. Antarctica makes up much of the land mass of the Southern Hemisphere, and 2019 was the warmest year over land on record (NOAA Global Climate Report). Permafrost Thaw Depths - Measurements at the Johann Gregor Mendel site (James Ross Island, Eastern Antarctic Peninsula, 63.8S, 57.866E) show that the active layer thickness increased sharply in 2019. Rising surface temperatures and an increased number of thawing degree days has resulted in higher soil temperatures at 5 and 75 cm deep (not shown), which in turn increases the thickness of the active layer. The primary difference between the two measurement sites is the underlying soil composition - the Circumpolar Active Layer Monitoring Network (CALM) site sits atop bed of loamy sediment, while the Johan Gregor Mendel site is over a marine terrace of sandy soil. Sea Ice Area - Sea ice in around Antarctica behaves differently than ice in the Northern Hemisphere. Each year, the sea ice in the Antarctic fluctuates significantly, where very little sea ice is present at the height of the austral summer but winter sea ice area can be as large as the Antarctic continent itself. According to APP-x data, average February sea ice area in 2019 was 1.48 million square kilometers, higher than the record and near-record lows of 2017 and 2018, but the third lowest in the overall data record. Low sea ice area totals correspond to the anomalously high surface temperatures in the Southern Hemisphere. Glacial Mass Balance - The Southern Hemisphere does not have many well-studied glaciers. Echaurren Norte in the Chilean Andes is one of the few southern glaciers with a long mass balance record. In Antarctica, the average mass balance of the Bahia Del Diablo, Johnsons, and Hurd glaciers were used here. From 2000 to 2019, the Antarctic glaciers have shown a slight trend of increasing mass balance. In 2019, the mass balance of Echaurren Norte was -2246 mm w.e. (millimeters water equivalent), its tenth consecutive year of decreasing mass and fourth year out of the last five in which it has lost over 1500 mm of water equivalent. Note: Bahia Del Diablo has not yet reported its 2019 mass balance total. The plotted 2019 value an average of the Hurd and Johnsons glaciers. Antarctic Ice Sheet Mass - The Antarctic Ice Sheet is the largest single mass of ice on Earth. West Antarctica and the Antarctic Peninsula have generally lost mass over the last 18 years, and increasing mass balance in East Antarctica has not been enough to keep the ice sheet from losing mass as a whole (Martin-Español, 2016). Since 2002, NASA’s Gravity Recovery and Climate Experiment (GRACE) satellites have been able to measure the local gravity changes near the Antarctic Ice Sheet, determining an approximate amount of ice lost each year in GT (gigatons; 1 GT = 1012 kilograms). As of May 2020, the Antarctic Ice Sheet had lost 2646 GT since measurements began in 2002. This is 1718 GT below the average mass of the 2002-2017 mean. |

Fig. 2. Changes in the SH or Antarctic from 1970-2019, except where noted. From the top down: surface temperature, February (summer) sea ice area, glacial mass balance, and Antarctic ice sheet mass anomalies. Grey lines are the 5-year running mean except for Antarctic ice mass, which shows the annual averages. See below for data sources. Hover the cursor over any of the plots for a larger version. Click on the plot for a full-size version of the stacked plot in a new browser tab.
Notes
1The “active layer” is the thawed surface layer above permafrost. Active layer thickness (ALT), or thaw depth, refers to the depth of the top layer of soil or rock that thaws during the Arctic summer before freezing again in the fall. Changes in temperature near the surface affect ALT, meaning that changes in ALT indicate a changing permafrost state for a given region. The depth of the ALT can range from a few meters in warmer, ice-rich environments to 20 m or greater in bedrock and the coldest permafrost regions. To best observe long-term change in the Arctic, continuous year-round ground temperature measurements within the upper 15 m can be analyzed. Active layer thicknesses are typically measured by mechanical probing at regular intervals, thaw-tube measurements, or inferring thaw depth based on ground temperature measurements.
Data Sources
Surface temperature: Extended AVHRR Polar Pathfinder (APP-x) dataset. https://www.ncdc.noaa.gov/cdr/atmospheric/extended-avhrr-polar-pathfinder-app-x
Permafrost thaw depths: Circumpolar Active Layer Monitoring (CALM), Northern Hemisphere Summary Data Table. https://www2.gwu.edu/~calm/data/north.html
September sea ice area: APP-x dataset. https://www.ncdc.noaa.gov/cdr/atmospheric/extended-avhrr-polar-pathfinder-app-x
Snowcover: Rutgers University Global Snow Lab, Monthly Area of Extent. http://climate.rutgers.edu/snowcover/table_area.php?ui_set=1&ui_sort=0
Glacial mass balance (global): World Glacier Monitoring Service (WGMS). http://wgms.ch/latest-glacier-mass-balance-data/
Greenland and Antarctica mass balance: NASA Global Climate Change, Land Ice. https://climate.nasa.gov/vital-signs/land-ice/
Thaw depth data from J.G. Mendel Station, Antarctica are courtesy of Filip Hrbáček, Masaryk University, Brno, Czech Republic.
References
AMAP, 2012. Arctic Climate Issues 2011: Changes in Arctic Snow, Water, Ice and Permafrost. SWIPA 2011 Overview Report.
Hrbáček F., Láska, K., Engel, Z., 2016. Effect of Snow Cover on the Active-Layer Thermal Regime – A Case Study from James Ross Island, Antarctic Peninsula. Permafrost and Periglacial Processes, 27, 307–315.
Hrbáček, F., Kňažková, M., Nývlt, D., Láska, K., Mueller, C.W., Ondruch, J., 2017. Active layer monitoring at CALM-S site near J.G.Mendel Station, James Ross Island, Eastern Antarctic Peninsula. Science of Total Environment. 601–602, 987–997.
Martín-Español, A., A. Zammit-Mangion, P. J. Clarke, T. Flament, V. Helm, M. A. King, S. B. Luthcke, E. Petrie, F. Rémy, N. Schön, et al. (2016), Spatial and temporal Antarctic Ice Sheet mass trends, glacio-isostatic adjustment, and surface processes from a joint inversion of satellite altimeter, gravity, and GPS data, J. Geophys. Res. Earth Surf., 121, 182–200, doi:10.1002/2015JF003550.
Watkins, MM, DN Wiese, D-N Yuan, C Boening, and FW Landerer (2015), Improved methods for observing Earth's time variable mass distribution with GRACE using spherical cap mascons. J. Geophys. Res. Solid Earth, 120, 2648_2671. doi: 10.1002/2014JB011547.
Wiese, D. N., D.-N. Yuan, C. Boening, F. W. Landerer, and M. M. Watkins (2016) JPL GRACE Mascon Ocean, Ice, and Hydrology Equivalent Water Height RL05M.1 CRI Filtered Version 2., Ver. 2., PO.DAAC, CA, USA. Dataset accessed [2018-06] at http://dx.doi.org/10.5067/TEMSC-2LCR.